

Pola sebenarnya

Double Bottom
was formed on 07.04 at 08:55:04 (UTC+0)
signal strength 1 of 5
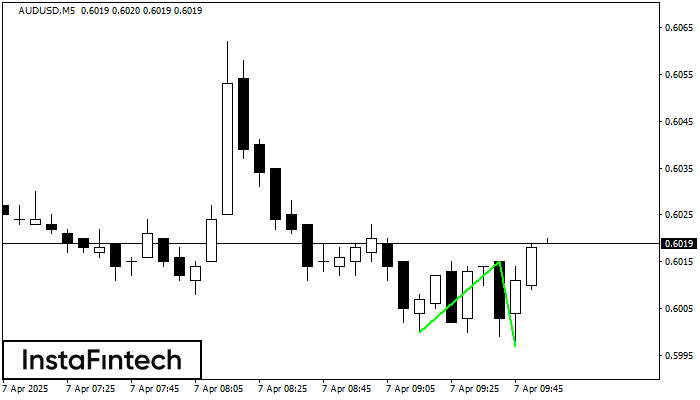
The Double Bottom pattern has been formed on AUDUSD M5; the upper boundary is 0.6015; the lower boundary is 0.5997. The width of the pattern is 15 points. In case of a break of the upper boundary 0.6015, a change in the trend can be predicted where the width of the pattern will coincide with the distance to a possible take profit level.
The M5 and M15 time frames may have more false entry points.
Lihat juga
- All
- All
- Bearish Rectangle
- Bearish Symmetrical Triangle
- Bearish Symmetrical Triangle
- Bullish Rectangle
- Double Top
- Double Top
- Triple Bottom
- Triple Bottom
- Triple Top
- Triple Top
- All
- All
- Buy
- Sale
- All
- 1
- 2
- 3
- 4
- 5
Double Bottom
was formed on 28.05 at 07:30:09 (UTC+0)
signal strength 2 of 5
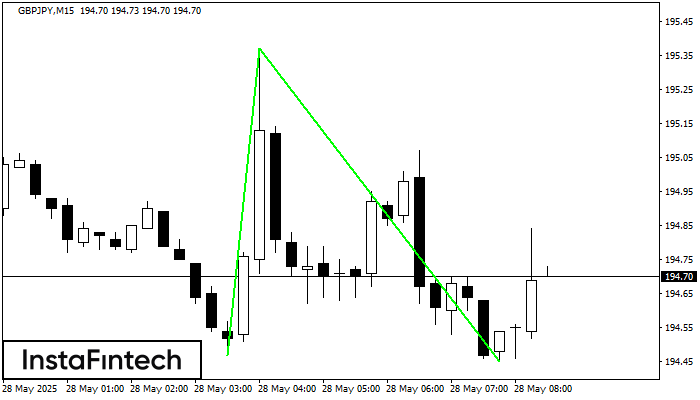
The Double Bottom pattern has been formed on GBPJPY M15; the upper boundary is 195.37; the lower boundary is 194.45. The width of the pattern is 90 points. In case
The M5 and M15 time frames may have more false entry points.
Open chart in a new window
Double Top
was formed on 28.05 at 06:30:45 (UTC+0)
signal strength 3 of 5
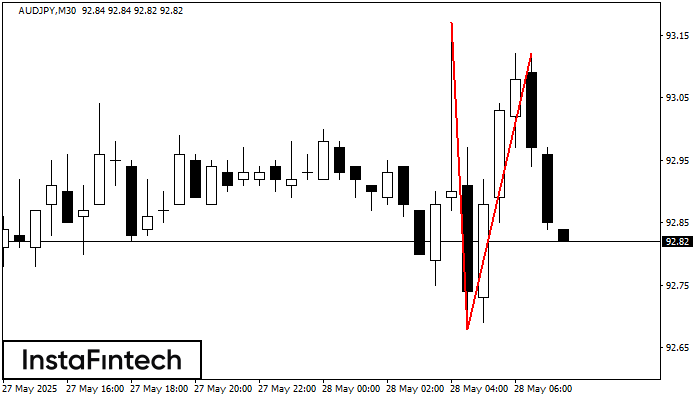
The Double Top pattern has been formed on AUDJPY M30. It signals that the trend has been changed from upwards to downwards. Probably, if the base of the pattern 92.68
Open chart in a new window
Double Top
was formed on 28.05 at 06:30:27 (UTC+0)
signal strength 2 of 5
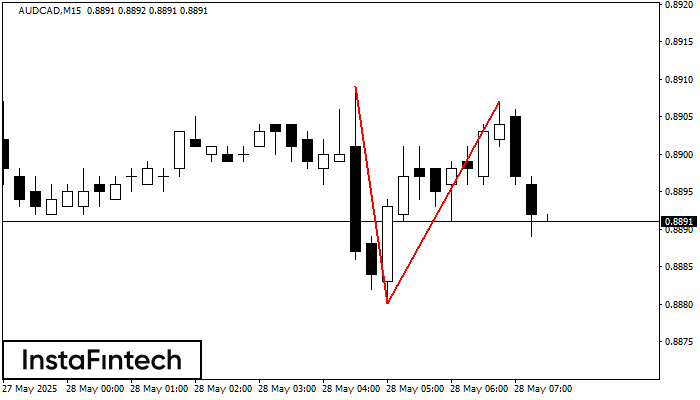
The Double Top pattern has been formed on AUDCAD M15. It signals that the trend has been changed from upwards to downwards. Probably, if the base of the pattern 0.8880
The M5 and M15 time frames may have more false entry points.
Open chart in a new window


