

Pola sebenarnya

Triple Top
was formed on 07.04 at 05:36:16 (UTC+0)
signal strength 1 of 5
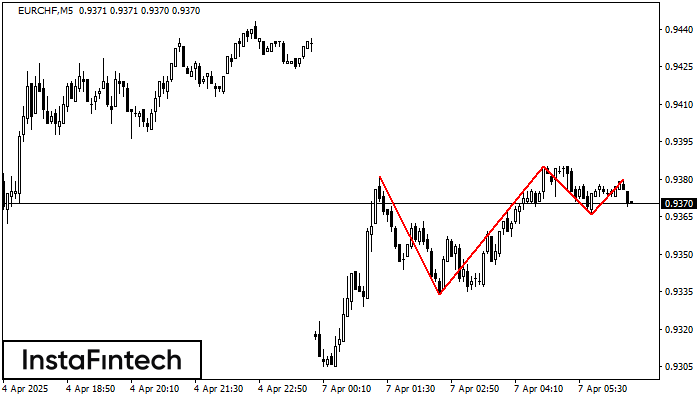
The Triple Top pattern has formed on the chart of the EURCHF M5. Features of the pattern: borders have an ascending angle; the lower line of the pattern has the coordinates 0.9334/0.9366 with the upper limit 0.9381/0.9380; the projection of the width is 47 points. The formation of the Triple Top figure most likely indicates a change in the trend from upward to downward. This means that in the event of a breakdown of the support level of 0.9334, the price is most likely to continue the downward movement.
The M5 and M15 time frames may have more false entry points.
- All
- All
- Bearish Rectangle
- Bearish Symmetrical Triangle
- Bearish Symmetrical Triangle
- Bullish Rectangle
- Double Top
- Double Top
- Triple Bottom
- Triple Bottom
- Triple Top
- Triple Top
- All
- All
- Buy
- Sale
- All
- 1
- 2
- 3
- 4
- 5
Double Top
was formed on 26.05 at 05:05:43 (UTC+0)
signal strength 1 of 5
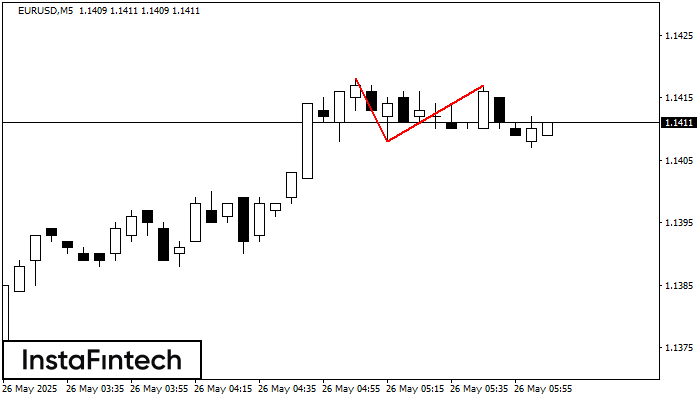
On the chart of EURUSD M5 the Double Top reversal pattern has been formed. Characteristics: the upper boundary 1.1417; the lower boundary 1.1408; the width of the pattern 9 points
The M5 and M15 time frames may have more false entry points.
Open chart in a new window
Double Top
was formed on 26.05 at 05:05:40 (UTC+0)
signal strength 1 of 5
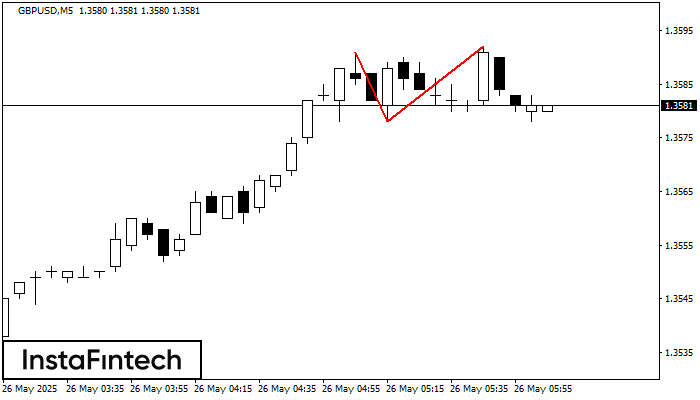
On the chart of GBPUSD M5 the Double Top reversal pattern has been formed. Characteristics: the upper boundary 1.3592; the lower boundary 1.3578; the width of the pattern 14 points
The M5 and M15 time frames may have more false entry points.
Open chart in a new window
Double Top
was formed on 26.05 at 04:15:25 (UTC+0)
signal strength 2 of 5
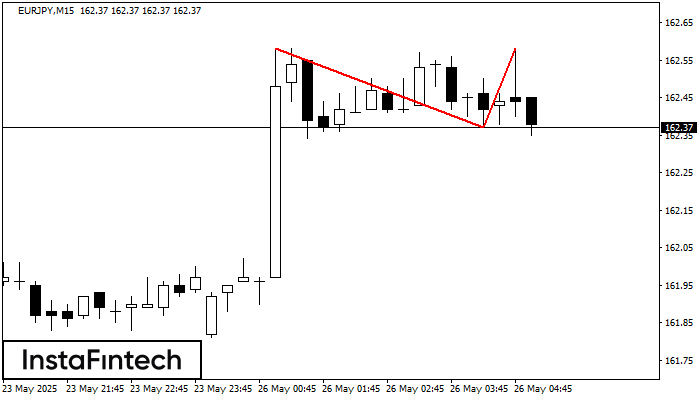
On the chart of EURJPY M15 the Double Top reversal pattern has been formed. Characteristics: the upper boundary 162.58; the lower boundary 162.37; the width of the pattern 21 points
The M5 and M15 time frames may have more false entry points.
Open chart in a new window


