

Pola sebenarnya

Bearish pennant
was formed on 07.04 at 01:00:16 (UTC+0)
signal strength 3 of 5

The Bearish pennant pattern has formed on the NZDUSD M30 chart. It signals potential continuation of the existing trend. Specifications: the pattern’s bottom has the coordinate of 0.5563; the projection of the flagpole height is equal to 29 pips. In case the price breaks out the pattern’s bottom of 0.5563, the downtrend is expected to continue for further level 0.5533.
Lihat juga
- All
- All
- Bearish Rectangle
- Bearish Symmetrical Triangle
- Bearish Symmetrical Triangle
- Bullish Rectangle
- Double Top
- Double Top
- Triple Bottom
- Triple Bottom
- Triple Top
- Triple Top
- All
- All
- Buy
- Sale
- All
- 1
- 2
- 3
- 4
- 5
Bawah Ganda
was formed on 05.08 at 10:00:07 (UTC+0)
signal strength 4 of 5
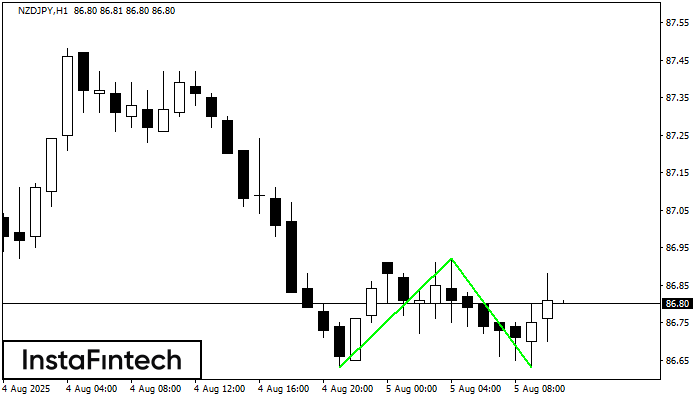
Pola Bawah Ganda telah terbentuk pada NZDJPY H1. Formasi ini mensinyalkan reversal tren dari arah penurunan ke arah kenaikan. Sinyal menunjukkan bahwa transaksi beli harus dibuka setelah batas atas pola
Open chart in a new window
Bawah Triple
was formed on 05.08 at 10:00:06 (UTC+0)
signal strength 4 of 5
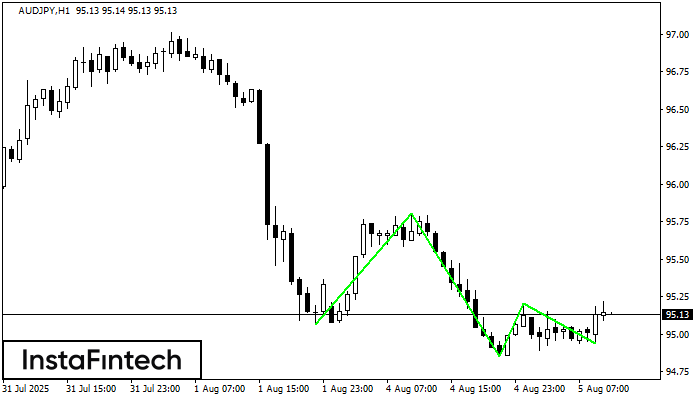
Pola Bawah Triple telah terbentuk pada AUDJPY H1. Pola tersebut memiliki karakteristik sebagai berikut: level resistance 95.80/95.20; level support 95.06/94.94; dengan lebar 74 poin. Jika terjadi pemecahan (breakdown) pada level
Open chart in a new window
Bawah Ganda
was formed on 05.08 at 09:30:12 (UTC+0)
signal strength 3 of 5
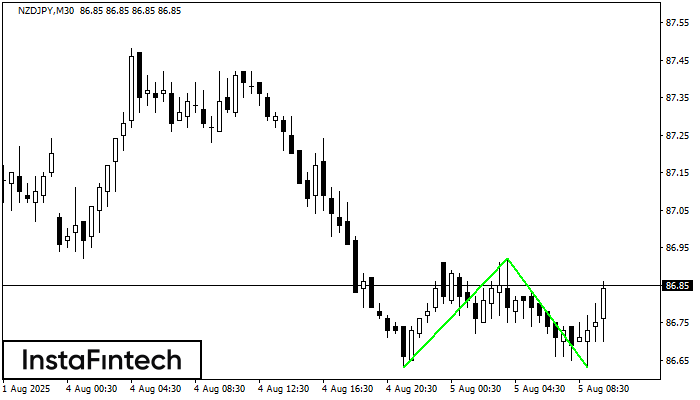
Pola Bawah Ganda telah terbentuk pada NZDJPY M30. Karakteristik: level support 86.63; level resistance 86.92; lebar pola 29 poin. Jika level resistance ditembus, perubahan dalam tren dapat diprediksi dengan target
Open chart in a new window


