

Pola sebenarnya

Inverse Head and Shoulder
was formed on 04.04 at 18:45:24 (UTC+0)
signal strength 2 of 5
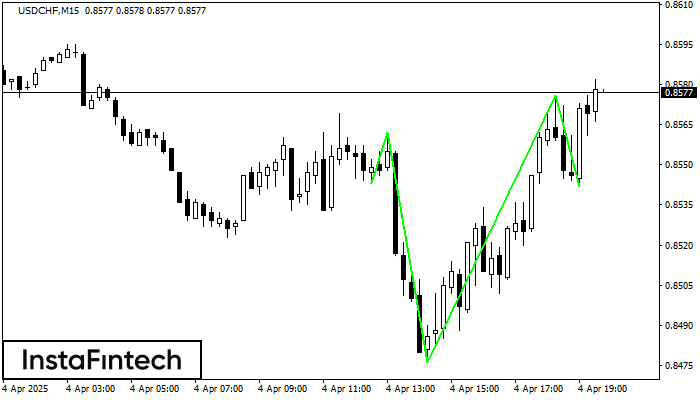
According to the chart of M15, USDCHF formed the Inverse Head and Shoulder pattern. The Head’s top is set at 0.8576 while the median line of the Neck is found at 0.8476/0.8542. The formation of the Inverse Head and Shoulder pattern evidently signals a reversal of the downward trend. In other words, in case the scenario comes true, the price of USDCHF will go towards 0.8598
The M5 and M15 time frames may have more false entry points.
- All
- All
- Bearish Rectangle
- Bearish Symmetrical Triangle
- Bearish Symmetrical Triangle
- Bullish Rectangle
- Double Top
- Double Top
- Triple Bottom
- Triple Bottom
- Triple Top
- Triple Top
- All
- All
- Buy
- Sale
- All
- 1
- 2
- 3
- 4
- 5
Бычий симметричный треугольник
сформирован 05.06 в 07:50:14 (UTC+0)
сила сигнала 1 из 5
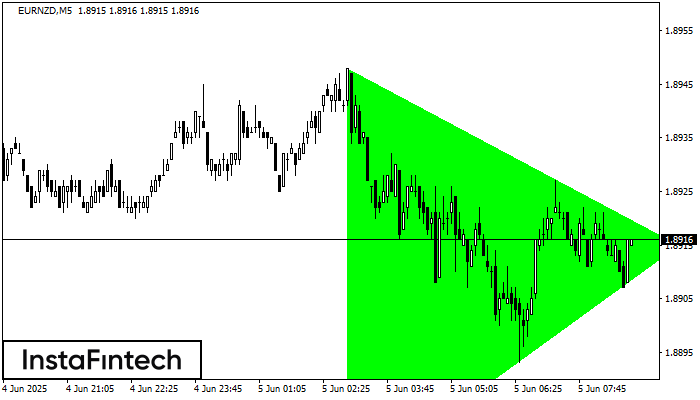
По EURNZD на M5 фигура «Бычий симметричный треугольник». Характеристика: Фигура продолжения тренда; Координаты границ – верхняя 1.8948, нижняя 1.8870. Проекция ширины фигуры 78 пунктов. Прогноз: В случае пробоя верхней границы
Таймфреймы М5 и М15 могут иметь больше ложных точек входа.
Открыть график инструмента в новом окне
Медвежий симметричный треугольник
сформирован 05.06 в 07:33:52 (UTC+0)
сила сигнала 3 из 5
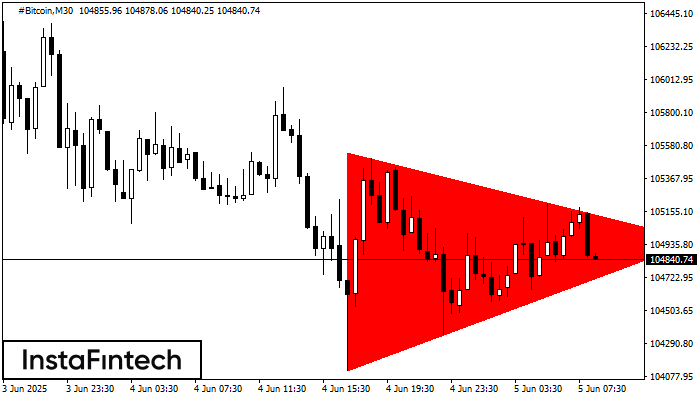
На графике #Bitcoin на M30 сформировалась фигура «Медвежий симметричный треугольник». Торговые рекомендации: Пробой нижней границы 104115.57 с большой долей вероятности приведет к продолжению нисходящего тренда
Открыть график инструмента в новом окне
Медвежий симметричный треугольник
сформирован 05.06 в 07:33:52 (UTC+0)
сила сигнала 2 из 5
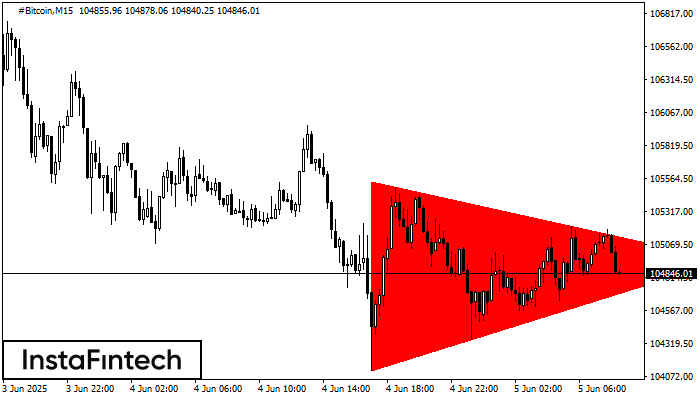
На графике #Bitcoin M15 сформировалась фигура «Медвежий симметричный треугольник». Характеристика фигуры: Нижняя граница 104115.57/104946.04; Верхняя граница 105540.33/104946.04; Проекция ширины фигуры -142476 пунктов. Формирование фигуры «Медвежий симметричный треугольник» наиболее вероятным образом
Таймфреймы М5 и М15 могут иметь больше ложных точек входа.
Открыть график инструмента в новом окне


