

Pola sebenarnya

Triple Bottom
was formed on 04.04 at 08:30:30 (UTC+0)
signal strength 3 of 5
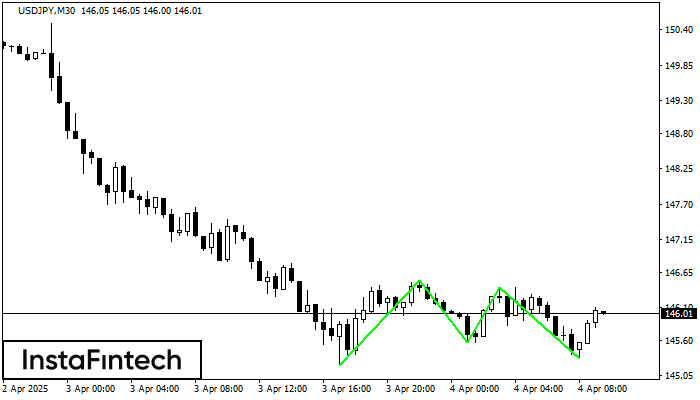
The Triple Bottom pattern has formed on the chart of the USDJPY M30 trading instrument. The pattern signals a change in the trend from downwards to upwards in the case of breakdown of 146.52/146.42.
- All
- All
- Bearish Rectangle
- Bearish Symmetrical Triangle
- Bearish Symmetrical Triangle
- Bullish Rectangle
- Double Top
- Double Top
- Triple Bottom
- Triple Bottom
- Triple Top
- Triple Top
- All
- All
- Buy
- Sale
- All
- 1
- 2
- 3
- 4
- 5
Bendera Bullish
was formed on 29.05 at 01:05:37 (UTC+0)
signal strength 1 of 5
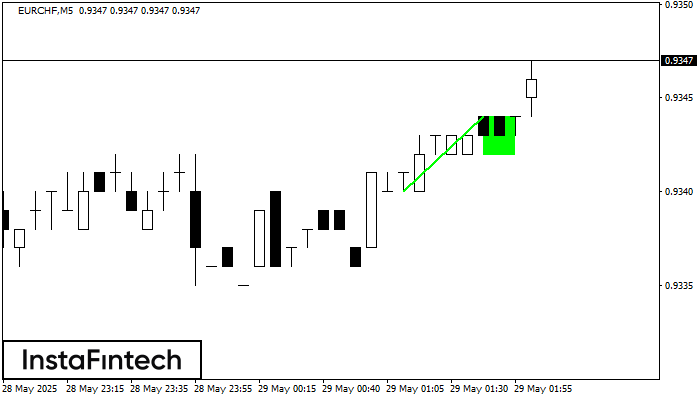
Pola Bendera Bullish telah terbentuk di grafik EURCHF M5, yang memberikan sinyal tren naik akan berlanjut. Sinyal: penembusan titik puncak di 0.9344 mungkin mendorong harga lebih tinggi, dan kenaikan akan
Rangka waktu M5 dan M15 mungkin memiliki lebih dari titik entri yang keliru.
Open chart in a new window
Persegi Bearish
was formed on 29.05 at 01:02:33 (UTC+0)
signal strength 2 of 5
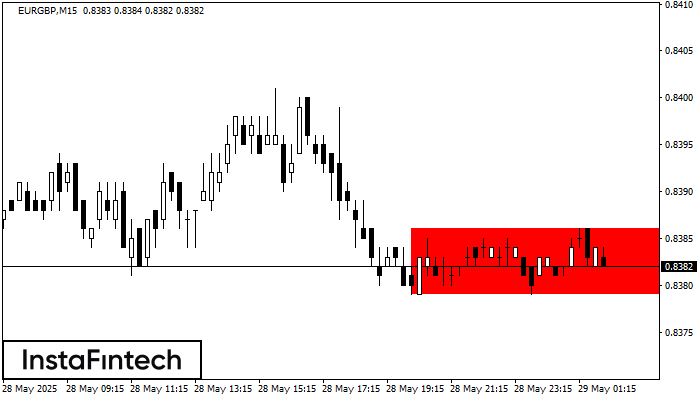
Menurut grafik dari M15, EURGBP terbentuk Persegi Bearish. Jenis pola ini menunjukkan kelanjutan tren. Terdiri dari dua tingkat: resistance 0.8386 - 0.0000 dan support 0.8379 – 0.8379. Jika level resistance
Rangka waktu M5 dan M15 mungkin memiliki lebih dari titik entri yang keliru.
Open chart in a new window
Bawah Ganda
was formed on 29.05 at 00:31:19 (UTC+0)
signal strength 3 of 5
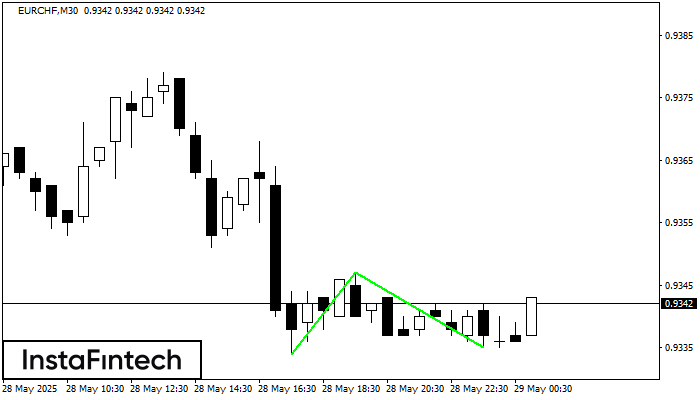
Pola Bawah Ganda telah terbentuk pada EURCHF M30; batas atas di 0.9347; batas bawah di 0.9335. Lebar pola sebesar 13 poin. Jika harga menembus batas atas 0.9347, Perubahan dalam tren
Open chart in a new window


