

Pola sebenarnya

Bullish Symmetrical Triangle
was formed on 04.04 at 05:20:08 (UTC+0)
signal strength 1 of 5

According to the chart of M5, #Bitcoin formed the Bullish Symmetrical Triangle pattern. Description: This is the pattern of a trend continuation. 83376.14 and 82331.42 are the coordinates of the upper and lower borders respectively. The pattern width is measured on the chart at 104472 pips. Outlook: If the upper border 83376.14 is broken, the price is likely to continue its move by 82907.57.
The M5 and M15 time frames may have more false entry points.
- All
- All
- Bearish Rectangle
- Bearish Symmetrical Triangle
- Bearish Symmetrical Triangle
- Bullish Rectangle
- Double Top
- Double Top
- Triple Bottom
- Triple Bottom
- Triple Top
- Triple Top
- All
- All
- Buy
- Sale
- All
- 1
- 2
- 3
- 4
- 5
Double Bottom
was formed on 17.04 at 08:44:57 (UTC+0)
signal strength 2 of 5
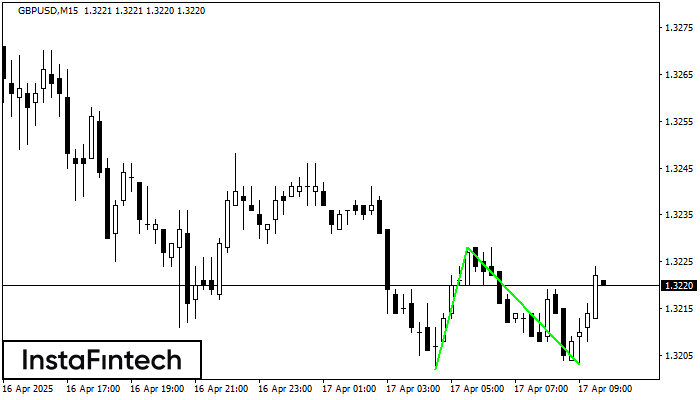
The Double Bottom pattern has been formed on GBPUSD M15. This formation signals a reversal of the trend from downwards to upwards. The signal is that a buy trade should
The M5 and M15 time frames may have more false entry points.
Open chart in a new window
Double Top
was formed on 17.04 at 08:30:06 (UTC+0)
signal strength 2 of 5
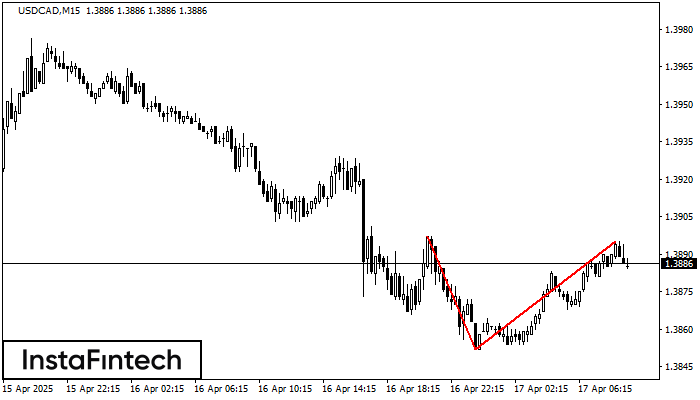
On the chart of USDCAD M15 the Double Top reversal pattern has been formed. Characteristics: the upper boundary 1.3895; the lower boundary 1.3852; the width of the pattern 43 points
The M5 and M15 time frames may have more false entry points.
Open chart in a new window
Double Bottom
was formed on 17.04 at 08:25:11 (UTC+0)
signal strength 1 of 5
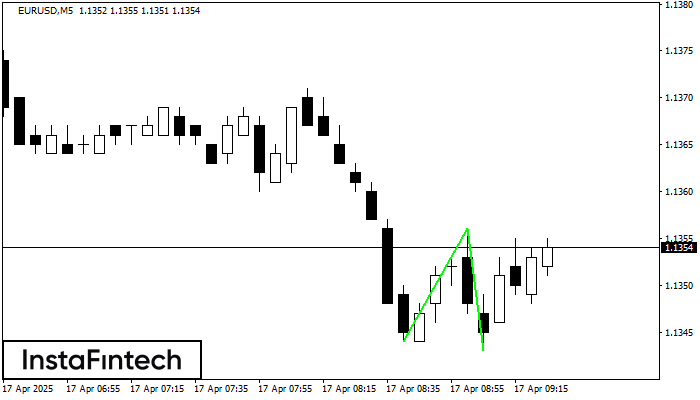
The Double Bottom pattern has been formed on EURUSD M5. Characteristics: the support level 1.1344; the resistance level 1.1356; the width of the pattern 12 points. If the resistance level
The M5 and M15 time frames may have more false entry points.
Open chart in a new window


