

Pola sebenarnya

Bearish pennant
was formed on 04.04 at 03:26:03 (UTC+0)
signal strength 1 of 5

The Bearish pennant pattern has formed on the AUDCAD M5 chart. It signals potential continuation of the existing trend. Specifications: the pattern’s bottom has the coordinate of 0.8881; the projection of the flagpole height is equal to 21 pips. In case the price breaks out the pattern’s bottom of 0.8881, the downtrend is expected to continue for further level 0.8866.
The M5 and M15 time frames may have more false entry points.
Lihat juga
- All
- All
- Bearish Rectangle
- Bearish Symmetrical Triangle
- Bearish Symmetrical Triangle
- Bullish Rectangle
- Double Top
- Double Top
- Triple Bottom
- Triple Bottom
- Triple Top
- Triple Top
- All
- All
- Buy
- Sale
- All
- 1
- 2
- 3
- 4
- 5
Persegi Bullish
was formed on 14.04 at 08:47:26 (UTC+0)
signal strength 1 of 5
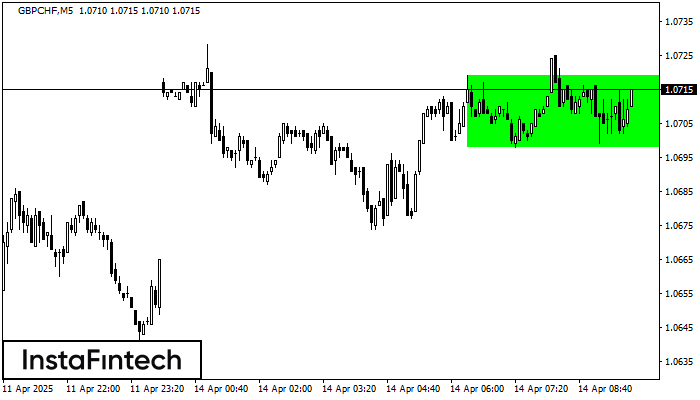
Menurut grafik dari M5, GBPCHF terbentuk Persegi Bullish yang merupakan pola dari kelanjutan tren. Pola terkandung dalam batas berikut: batas yang lebih rendah 1.0698 – 1.0698 dan batas atas 1.0719
Rangka waktu M5 dan M15 mungkin memiliki lebih dari titik entri yang keliru.
Open chart in a new window
Bawah Triple
was formed on 14.04 at 08:00:19 (UTC+0)
signal strength 2 of 5
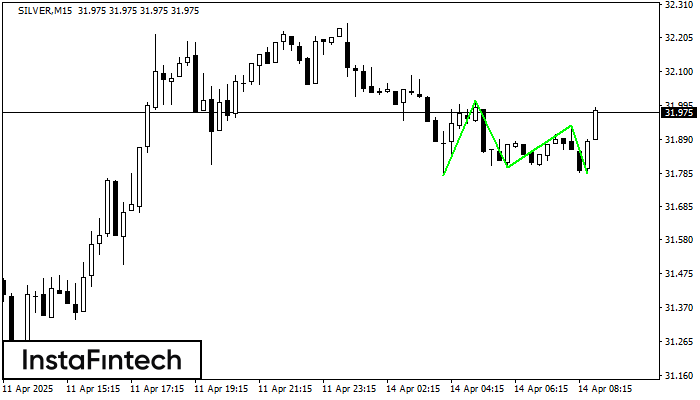
Pola Bawah Triple telah terbentuk pada grafik instrumen trading SILVER M15. Pola tersebut menandakan perubahan dalam trend dari menurun menjadi naik jika terjadi pemecahan (breakdown) 32.01/31.93
Rangka waktu M5 dan M15 mungkin memiliki lebih dari titik entri yang keliru.
Open chart in a new window
Teratas Triple
was formed on 14.04 at 07:35:12 (UTC+0)
signal strength 1 of 5
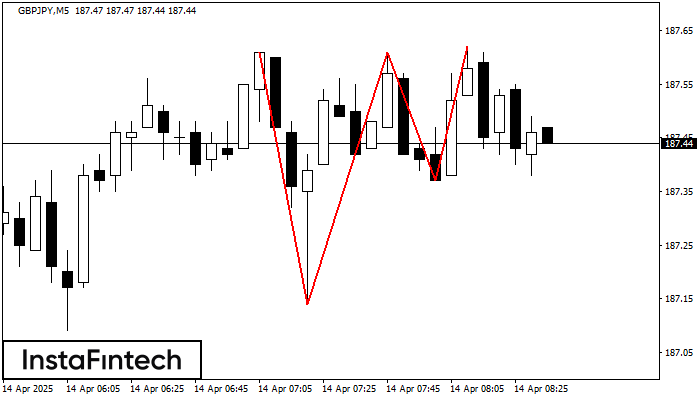
Pola Teratas Triple telah terbentuk pada grafik GBPJPY M5. Fitur-fitur pola: perbatasan memiliki sudut yang naik; batas bawah pola memiliki koordinat 187.14/187.37 dengan batas atas 187.61/187.62; proyeksi lebar adalah
Rangka waktu M5 dan M15 mungkin memiliki lebih dari titik entri yang keliru.
Open chart in a new window


