

Pola sebenarnya

Bearish Symmetrical Triangle
was formed on 04.04 at 02:33:14 (UTC+0)
signal strength 2 of 5
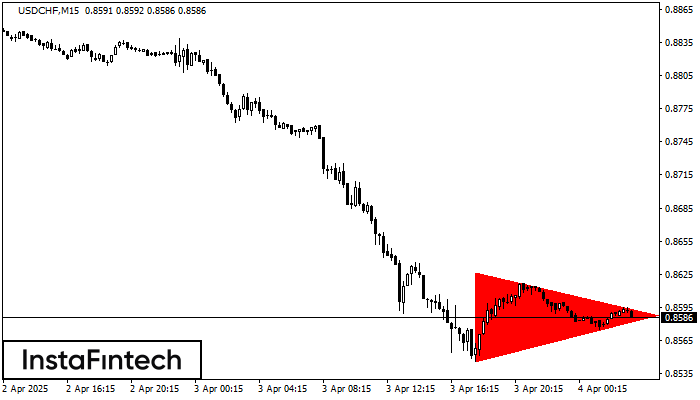
According to the chart of M15, USDCHF formed the Bearish Symmetrical Triangle pattern. This pattern signals a further downward trend in case the lower border 0.8546 is breached. Here, a hypothetical profit will equal the width of the available pattern that is -80 pips.
The M5 and M15 time frames may have more false entry points.
- All
- All
- Bearish Rectangle
- Bearish Symmetrical Triangle
- Bearish Symmetrical Triangle
- Bullish Rectangle
- Double Top
- Double Top
- Triple Bottom
- Triple Bottom
- Triple Top
- Triple Top
- All
- All
- Buy
- Sale
- All
- 1
- 2
- 3
- 4
- 5
Bullish Symmetrical Triangle
was formed on 23.04 at 14:34:58 (UTC+0)
signal strength 1 of 5
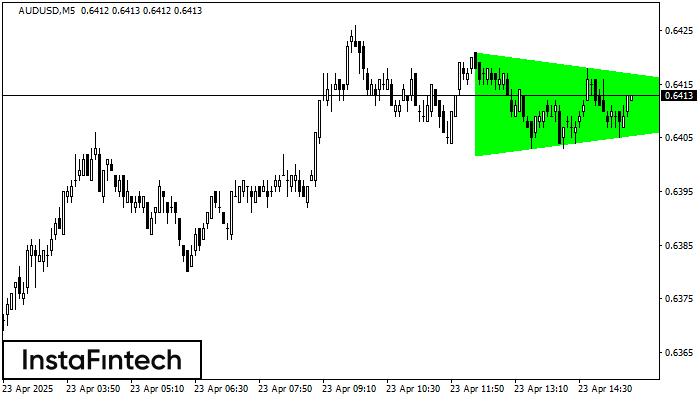
According to the chart of M5, AUDUSD formed the Bullish Symmetrical Triangle pattern. The lower border of the pattern touches the coordinates 0.6402/0.6411 whereas the upper border goes across 0.6421/0.6411
The M5 and M15 time frames may have more false entry points.
Open chart in a new window
Double Bottom
was formed on 23.04 at 14:09:50 (UTC+0)
signal strength 1 of 5
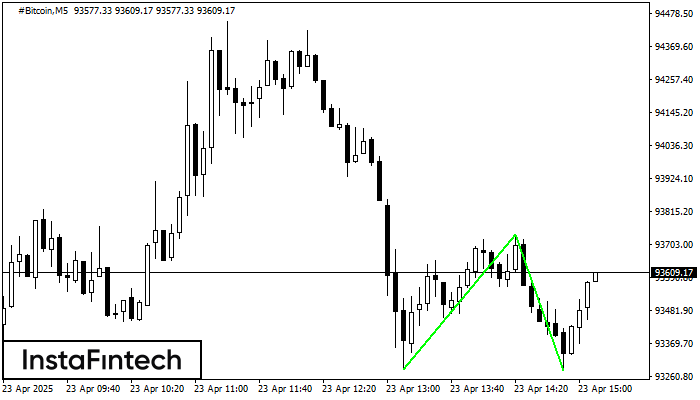
The Double Bottom pattern has been formed on #Bitcoin M5; the upper boundary is 93737.29; the lower boundary is 93280.25. The width of the pattern is 45284 points. In case
The M5 and M15 time frames may have more false entry points.
Open chart in a new window
Bearish Symmetrical Triangle
was formed on 23.04 at 13:22:55 (UTC+0)
signal strength 1 of 5

According to the chart of M5, EURJPY formed the Bearish Symmetrical Triangle pattern. Description: The lower border is 161.15/161.86 and upper border is 162.37/161.86. The pattern width is measured
The M5 and M15 time frames may have more false entry points.
Open chart in a new window


