

Pola sebenarnya

Bearish Symmetrical Triangle
was formed on 03.04 at 20:05:13 (UTC+0)
signal strength 1 of 5
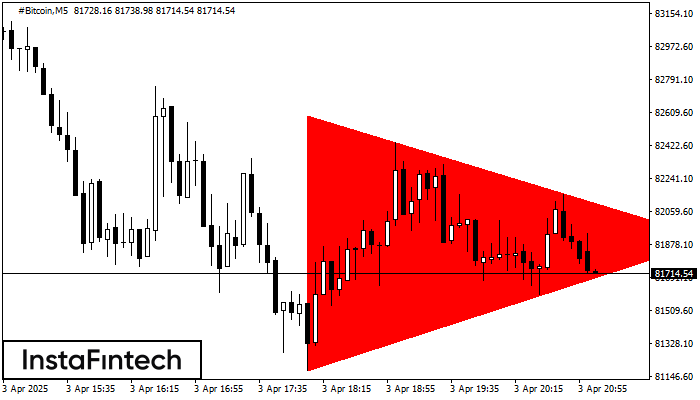
According to the chart of M5, #Bitcoin formed the Bearish Symmetrical Triangle pattern. Description: The lower border is 81178.46/81904.02 and upper border is 82588.16/81904.02. The pattern width is measured on the chart at -140970 pips. The formation of the Bearish Symmetrical Triangle pattern evidently signals a continuation of the downward trend. In other words, if the scenario comes true and #Bitcoin breaches the lower border, the price could continue its move toward 81903.87.
The M5 and M15 time frames may have more false entry points.
- All
- All
- Bearish Rectangle
- Bearish Symmetrical Triangle
- Bearish Symmetrical Triangle
- Bullish Rectangle
- Double Top
- Double Top
- Triple Bottom
- Triple Bottom
- Triple Top
- Triple Top
- All
- All
- Buy
- Sale
- All
- 1
- 2
- 3
- 4
- 5
Teratas Ganda
was formed on 23.04 at 04:00:20 (UTC+0)
signal strength 2 of 5
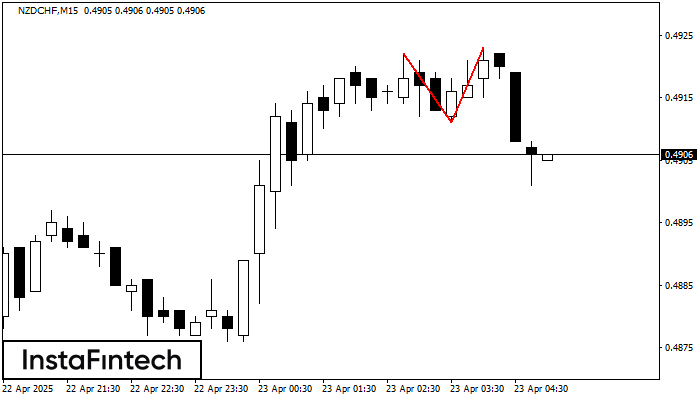
Pola Teratas Ganda telah terbentuk pada NZDCHF M15. Pola ini menandakan bahwa tren telah berubah dari kenaikan menjadi penurunan. Mungkin, jika dasar pola di 0.4911 ditembus, maka pergerakan menurun akan
Rangka waktu M5 dan M15 mungkin memiliki lebih dari titik entri yang keliru.
Open chart in a new window
Bawah Ganda
was formed on 23.04 at 03:45:13 (UTC+0)
signal strength 2 of 5
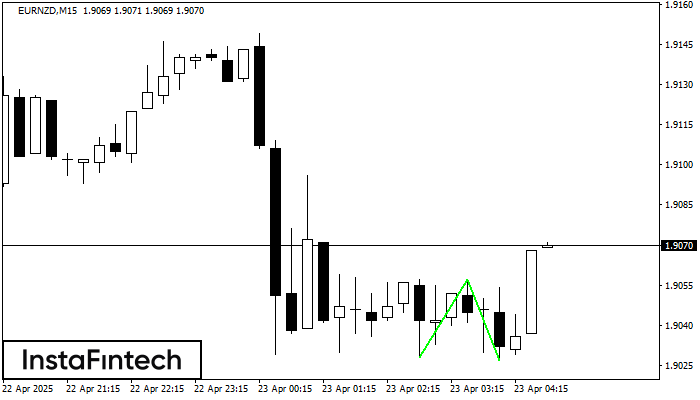
Pola Bawah Ganda telah terbentuk pada EURNZD M15; batas atas di 1.9057; batas bawah di 1.9027. Lebar pola sebesar 29 poin. Jika harga menembus batas atas 1.9057, Perubahan dalam tren
Rangka waktu M5 dan M15 mungkin memiliki lebih dari titik entri yang keliru.
Open chart in a new window
Teratas Ganda
was formed on 23.04 at 03:35:42 (UTC+0)
signal strength 1 of 5
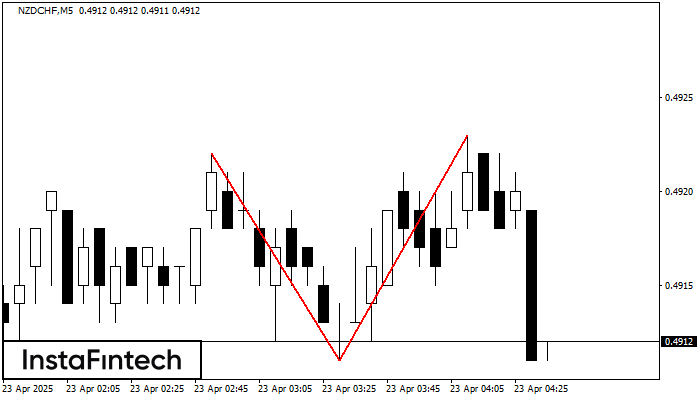
Pola reversal Teratas Ganda telah terbentuk pada NZDCHF M5. Karakteristik: batas atas 0.4922; batas bawah 0.4911; lebar pola 12 poin. Transaksi jual lebih baik dibuka di bawah batas bawah 0.4911
Rangka waktu M5 dan M15 mungkin memiliki lebih dari titik entri yang keliru.
Open chart in a new window

