

Pola sebenarnya

Double Bottom
was formed on 03.04 at 19:30:42 (UTC+0)
signal strength 2 of 5
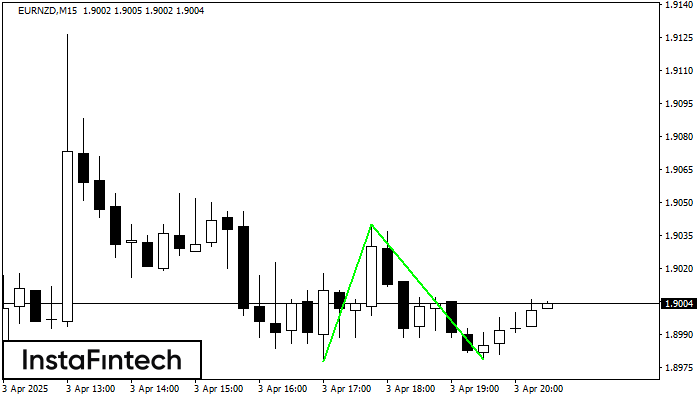
The Double Bottom pattern has been formed on EURNZD M15; the upper boundary is 1.9040; the lower boundary is 1.8979. The width of the pattern is 62 points. In case of a break of the upper boundary 1.9040, a change in the trend can be predicted where the width of the pattern will coincide with the distance to a possible take profit level.
The M5 and M15 time frames may have more false entry points.
Lihat juga
- All
- All
- Bearish Rectangle
- Bearish Symmetrical Triangle
- Bearish Symmetrical Triangle
- Bullish Rectangle
- Double Top
- Double Top
- Triple Bottom
- Triple Bottom
- Triple Top
- Triple Top
- All
- All
- Buy
- Sale
- All
- 1
- 2
- 3
- 4
- 5
Bullish Rectangle
was formed on 02.06 at 19:05:14 (UTC+0)
signal strength 1 of 5
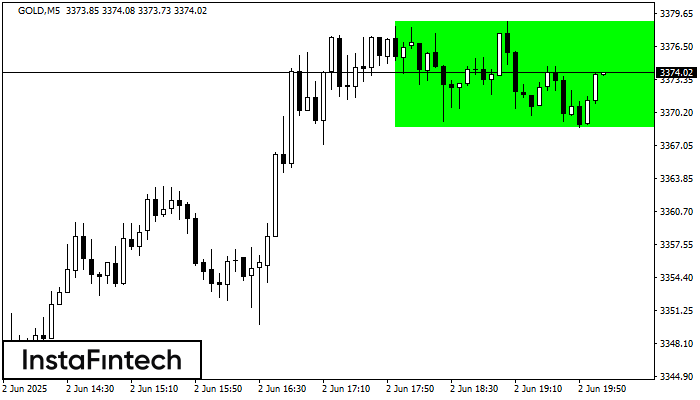
According to the chart of M5, GOLD formed the Bullish Rectangle. This type of a pattern indicates a trend continuation. It consists of two levels: resistance 3378.88 and support 3368.80
The M5 and M15 time frames may have more false entry points.
Open chart in a new window
Double Top
was formed on 02.06 at 18:45:13 (UTC+0)
signal strength 2 of 5
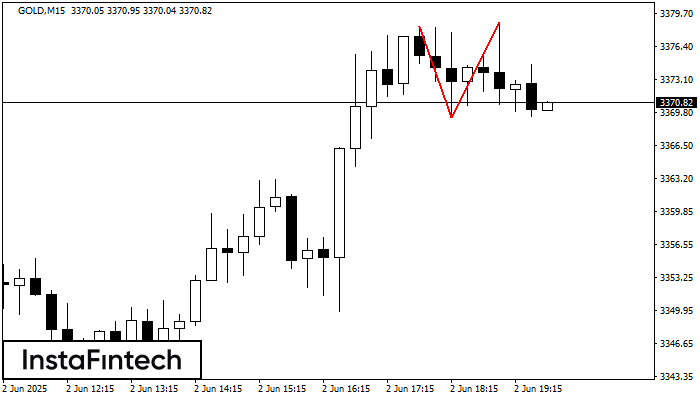
On the chart of GOLD M15 the Double Top reversal pattern has been formed. Characteristics: the upper boundary 3378.88; the lower boundary 3369.32; the width of the pattern 956 points
The M5 and M15 time frames may have more false entry points.
Open chart in a new window
Bullish Symmetrical Triangle
was formed on 02.06 at 18:31:13 (UTC+0)
signal strength 1 of 5
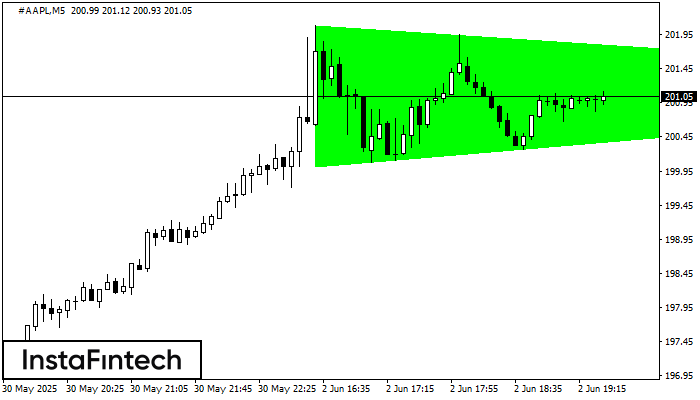
According to the chart of M5, #AAPL formed the Bullish Symmetrical Triangle pattern. The lower border of the pattern touches the coordinates 200.01/201.18 whereas the upper border goes across 202.09/201.18
The M5 and M15 time frames may have more false entry points.
Open chart in a new window


