

Pola sebenarnya

Bearish Rectangle
was formed on 03.04 at 18:35:46 (UTC+0)
signal strength 1 of 5
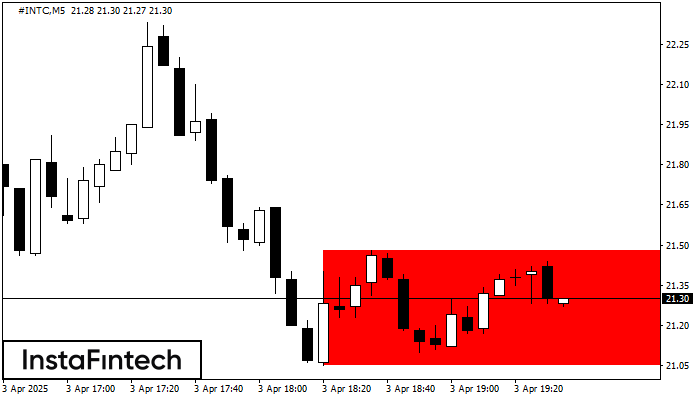
According to the chart of M5, #INTC formed the Bearish Rectangle. This type of a pattern indicates a trend continuation. It consists of two levels: resistance 21.48 - 0.00 and support 21.05 – 21.05. In case the resistance level 21.05 - 21.05 is broken, the instrument is likely to follow the bearish trend.
The M5 and M15 time frames may have more false entry points.
- All
- All
- Bearish Rectangle
- Bearish Symmetrical Triangle
- Bearish Symmetrical Triangle
- Bullish Rectangle
- Double Top
- Double Top
- Triple Bottom
- Triple Bottom
- Triple Top
- Triple Top
- All
- All
- Buy
- Sale
- All
- 1
- 2
- 3
- 4
- 5
Double Bottom
was formed on 22.04 at 12:20:21 (UTC+0)
signal strength 1 of 5

The Double Bottom pattern has been formed on AUDCHF M5. This formation signals a reversal of the trend from downwards to upwards. The signal is that a buy trade should
The M5 and M15 time frames may have more false entry points.
Open chart in a new window
Bearish Rectangle
was formed on 22.04 at 12:07:02 (UTC+0)
signal strength 3 of 5
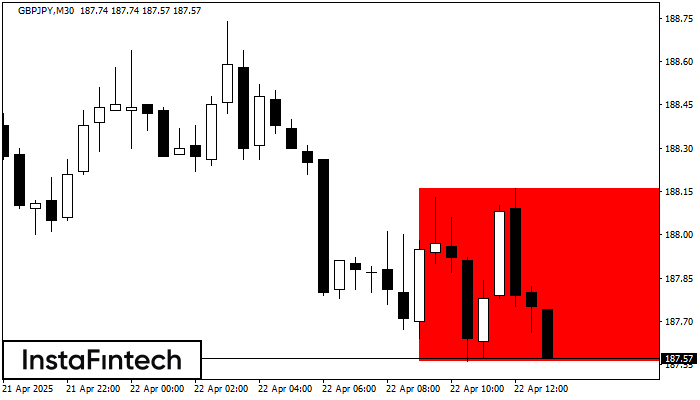
According to the chart of M30, GBPJPY formed the Bearish Rectangle which is a pattern of a trend continuation. The pattern is contained within the following borders: lower border 187.56
Open chart in a new window
Bearish Rectangle
was formed on 22.04 at 12:07:00 (UTC+0)
signal strength 2 of 5
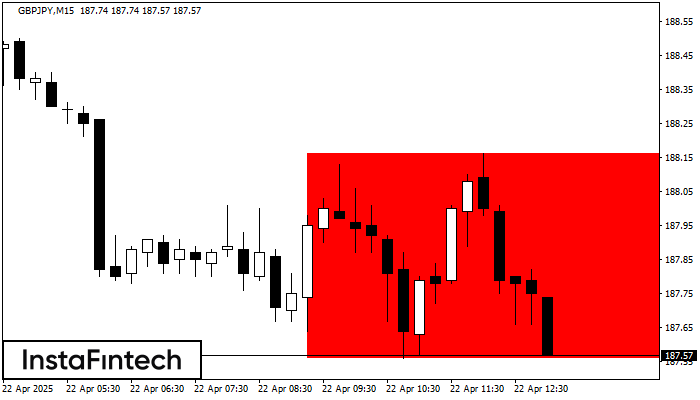
According to the chart of M15, GBPJPY formed the Bearish Rectangle which is a pattern of a trend continuation. The pattern is contained within the following borders: lower border 187.56
The M5 and M15 time frames may have more false entry points.
Open chart in a new window


