

Pola sebenarnya

Bearish pennant
was formed on 03.04 at 16:04:54 (UTC+0)
signal strength 1 of 5
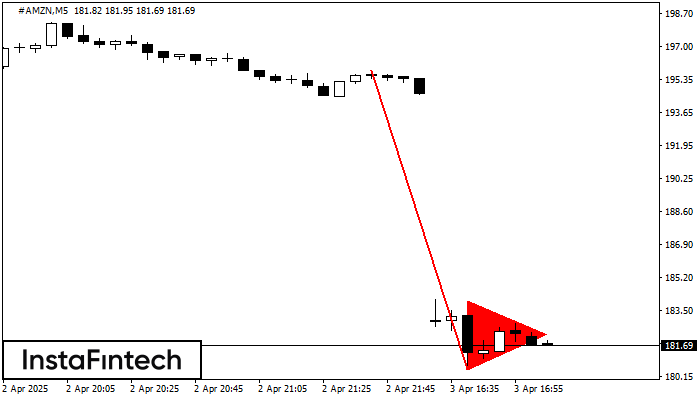
The Bearish pennant pattern has formed on the #AMZN M5 chart. This pattern type is characterized by a slight slowdown after which the price will move in the direction of the original trend. In case the price fixes below the pattern’s low of 180.49, a trader will be able to successfully enter the sell position.
The M5 and M15 time frames may have more false entry points.
- All
- All
- Bearish Rectangle
- Bearish Symmetrical Triangle
- Bearish Symmetrical Triangle
- Bullish Rectangle
- Double Top
- Double Top
- Triple Bottom
- Triple Bottom
- Triple Top
- Triple Top
- All
- All
- Buy
- Sale
- All
- 1
- 2
- 3
- 4
- 5
Double Top
was formed on 29.05 at 11:30:15 (UTC+0)
signal strength 1 of 5

The Double Top reversal pattern has been formed on SILVER M5. Characteristics: the upper boundary 33.30; the lower boundary 33.19; the width of the pattern is 115 points. Sell trades
The M5 and M15 time frames may have more false entry points.
Open chart in a new window
Bearish Rectangle
was formed on 29.05 at 10:50:07 (UTC+0)
signal strength 1 of 5
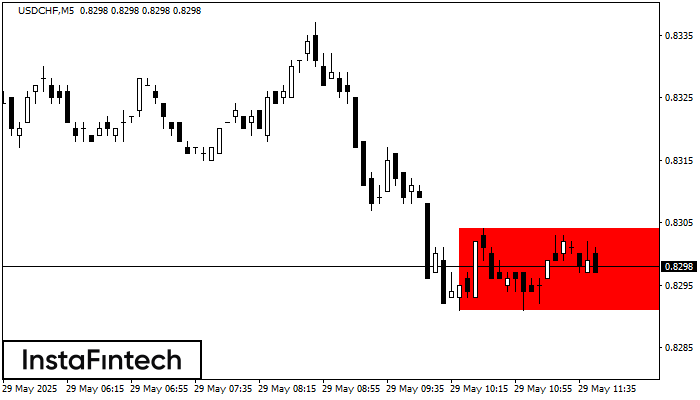
According to the chart of M5, USDCHF formed the Bearish Rectangle. This type of a pattern indicates a trend continuation. It consists of two levels: resistance 0.8304 - 0.0000
The M5 and M15 time frames may have more false entry points.
Open chart in a new window
Double Bottom
was formed on 29.05 at 10:20:05 (UTC+0)
signal strength 1 of 5
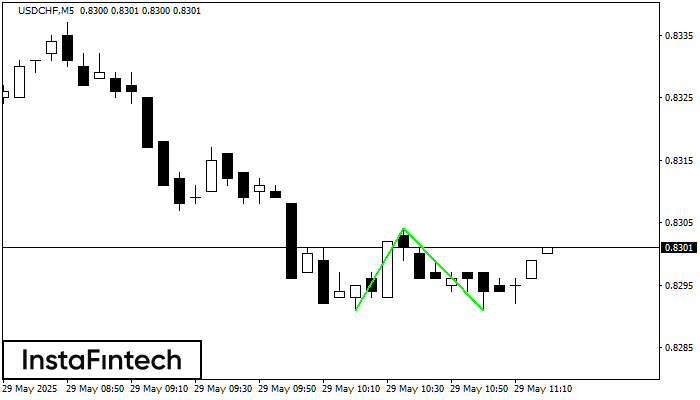
The Double Bottom pattern has been formed on USDCHF M5; the upper boundary is 0.8304; the lower boundary is 0.8291. The width of the pattern is 13 points. In case
The M5 and M15 time frames may have more false entry points.
Open chart in a new window


