

Pola sebenarnya

Double Bottom
was formed on 03.04 at 10:10:29 (UTC+0)
signal strength 1 of 5
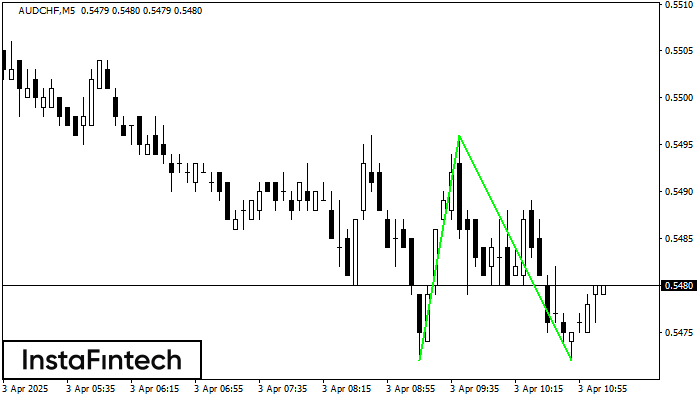
The Double Bottom pattern has been formed on AUDCHF M5. This formation signals a reversal of the trend from downwards to upwards. The signal is that a buy trade should be opened after the upper boundary of the pattern 0.5496 is broken. The further movements will rely on the width of the current pattern 24 points.
The M5 and M15 time frames may have more false entry points.
Lihat juga
- All
- All
- Bearish Rectangle
- Bearish Symmetrical Triangle
- Bearish Symmetrical Triangle
- Bullish Rectangle
- Double Top
- Double Top
- Triple Bottom
- Triple Bottom
- Triple Top
- Triple Top
- All
- All
- Buy
- Sale
- All
- 1
- 2
- 3
- 4
- 5
Double Top
was formed on 16.05 at 16:25:30 (UTC+0)
signal strength 1 of 5
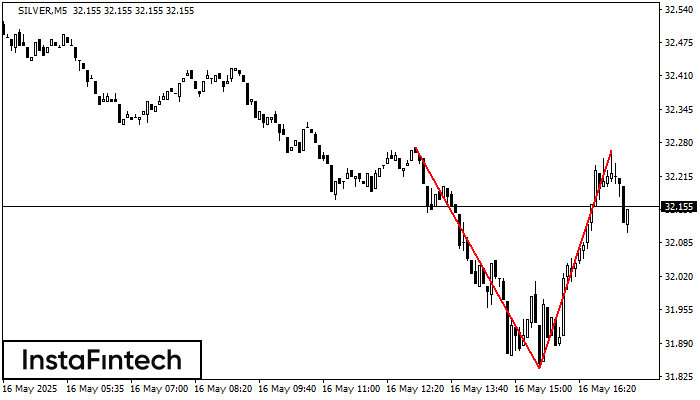
The Double Top reversal pattern has been formed on SILVER M5. Characteristics: the upper boundary 32.27; the lower boundary 31.84; the width of the pattern is 425 points. Sell trades
The M5 and M15 time frames may have more false entry points.
Open chart in a new window
Double Top
was formed on 16.05 at 15:40:56 (UTC+0)
signal strength 1 of 5
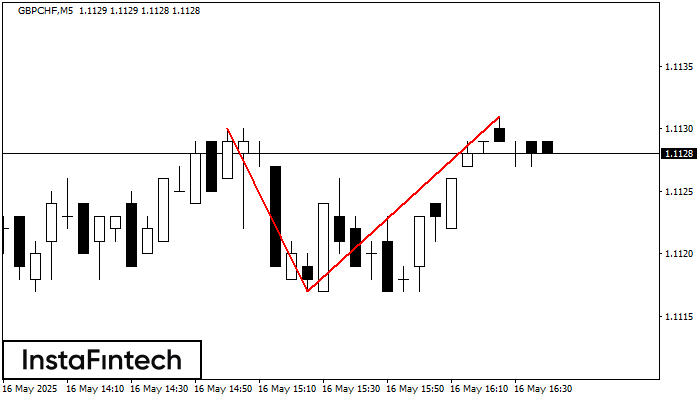
The Double Top pattern has been formed on GBPCHF M5. It signals that the trend has been changed from upwards to downwards. Probably, if the base of the pattern 1.1117
The M5 and M15 time frames may have more false entry points.
Open chart in a new window
Bullish Symmetrical Triangle
was formed on 16.05 at 15:30:47 (UTC+0)
signal strength 3 of 5
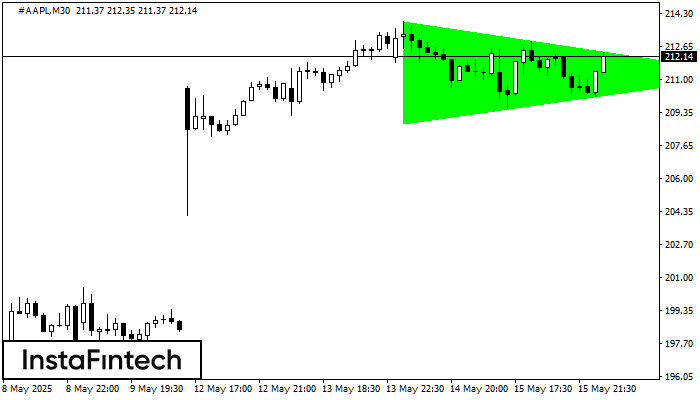
According to the chart of M30, #AAPL formed the Bullish Symmetrical Triangle pattern. The lower border of the pattern touches the coordinates 208.80/211.23 whereas the upper border goes across 213.91/211.23
Open chart in a new window


