

Pola sebenarnya

Double Bottom
was formed on 02.04 at 14:15:21 (UTC+0)
signal strength 2 of 5
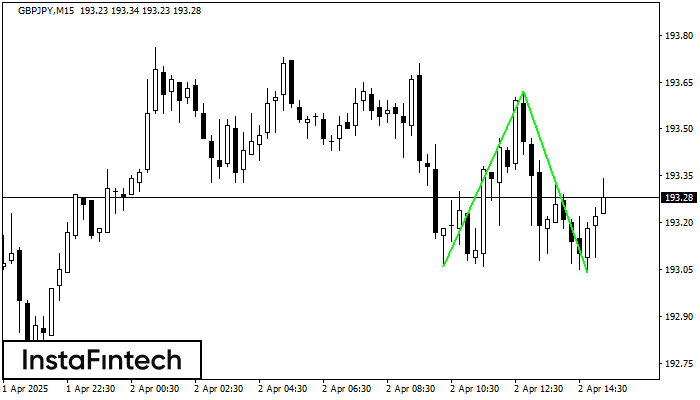
The Double Bottom pattern has been formed on GBPJPY M15. This formation signals a reversal of the trend from downwards to upwards. The signal is that a buy trade should be opened after the upper boundary of the pattern 193.62 is broken. The further movements will rely on the width of the current pattern 56 points.
The M5 and M15 time frames may have more false entry points.
- All
- All
- Bearish Rectangle
- Bearish Symmetrical Triangle
- Bearish Symmetrical Triangle
- Bullish Rectangle
- Double Top
- Double Top
- Triple Bottom
- Triple Bottom
- Triple Top
- Triple Top
- All
- All
- Buy
- Sale
- All
- 1
- 2
- 3
- 4
- 5
Bawah Ganda
was formed on 28.05 at 04:45:28 (UTC+0)
signal strength 1 of 5
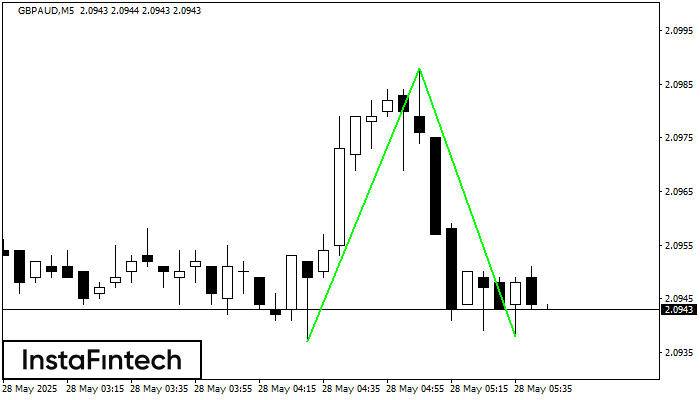
Pola Bawah Ganda telah terbentuk pada GBPAUD M5; batas atas di 2.0988; batas bawah di 2.0938. Lebar pola sebesar 51 poin. Jika harga menembus batas atas 2.0988, Perubahan dalam tren
Rangka waktu M5 dan M15 mungkin memiliki lebih dari titik entri yang keliru.
Open chart in a new window
Bawah Triple
was formed on 28.05 at 04:36:13 (UTC+0)
signal strength 1 of 5
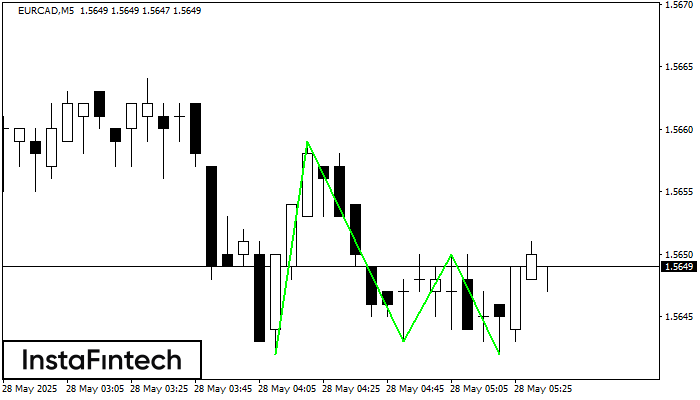
Pola Bawah Triple telah terbentuk pada grafik instrumen trading EURCAD M5. Pola tersebut menandakan perubahan dalam trend dari menurun menjadi naik jika terjadi pemecahan (breakdown) 1.5659/1.5650
Rangka waktu M5 dan M15 mungkin memiliki lebih dari titik entri yang keliru.
Open chart in a new window
Panji Bearish
was formed on 28.05 at 04:02:50 (UTC+0)
signal strength 1 of 5
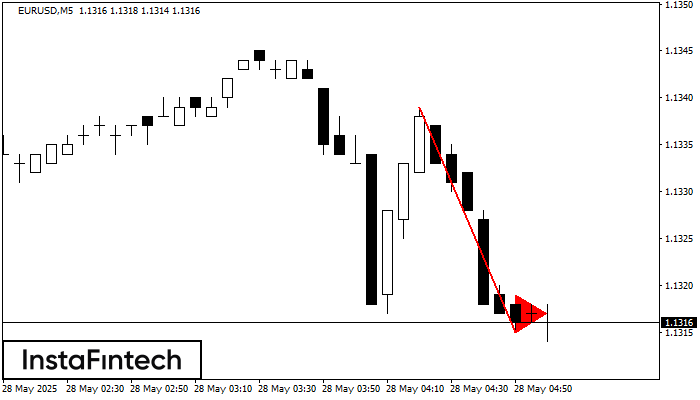
Pola Panji Bearish telah terbentuk di grafik Panji Bearish. Pola ini memberikan sinyal kelanjutan tren menurun jika titik terendah panji, di 1.1315 ditembus. Rekomendasi: Tempatkan sell stop pending order
Rangka waktu M5 dan M15 mungkin memiliki lebih dari titik entri yang keliru.
Open chart in a new window


