

Pola sebenarnya

Double Bottom
was formed on 02.04 at 10:30:25 (UTC+0)
signal strength 3 of 5
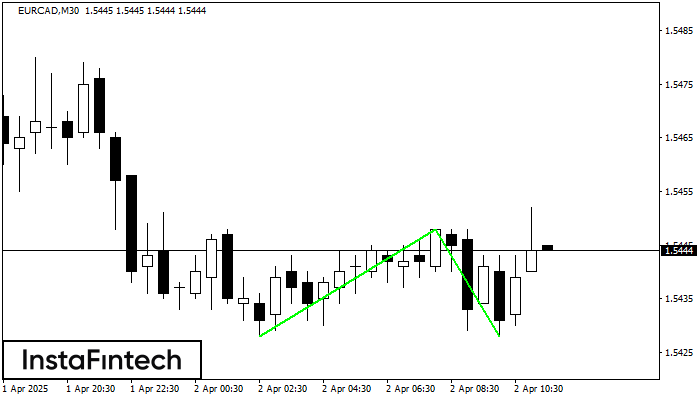
The Double Bottom pattern has been formed on EURCAD M30. Characteristics: the support level 1.5428; the resistance level 1.5448; the width of the pattern 20 points. If the resistance level is broken, a change in the trend can be predicted with the first target point lying at the distance of 20 points.
- All
- All
- Bearish Rectangle
- Bearish Symmetrical Triangle
- Bearish Symmetrical Triangle
- Bullish Rectangle
- Double Top
- Double Top
- Triple Bottom
- Triple Bottom
- Triple Top
- Triple Top
- All
- All
- Buy
- Sale
- All
- 1
- 2
- 3
- 4
- 5
Bawah Triple
was formed on 23.04 at 20:00:49 (UTC+0)
signal strength 1 of 5
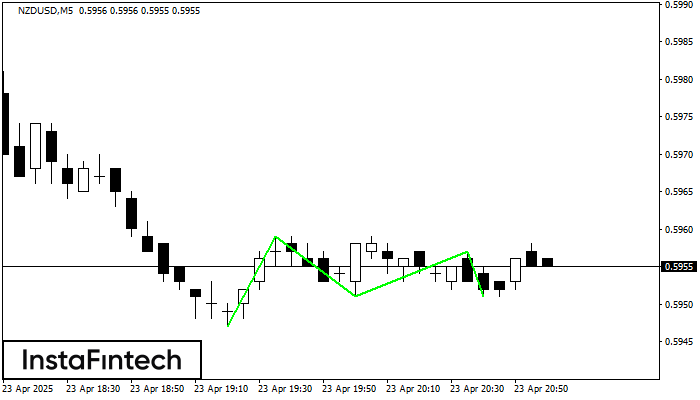
Pola Bawah Triple telah terbentuk pada NZDUSD M5. Pola tersebut memiliki karakteristik sebagai berikut: level resistance 0.5959/0.5957; level support 0.5947/0.5951; dengan lebar 12 poin. Jika terjadi pemecahan (breakdown) pada level
Rangka waktu M5 dan M15 mungkin memiliki lebih dari titik entri yang keliru.
Open chart in a new window
Bawah Ganda
was formed on 23.04 at 20:00:30 (UTC+0)
signal strength 1 of 5
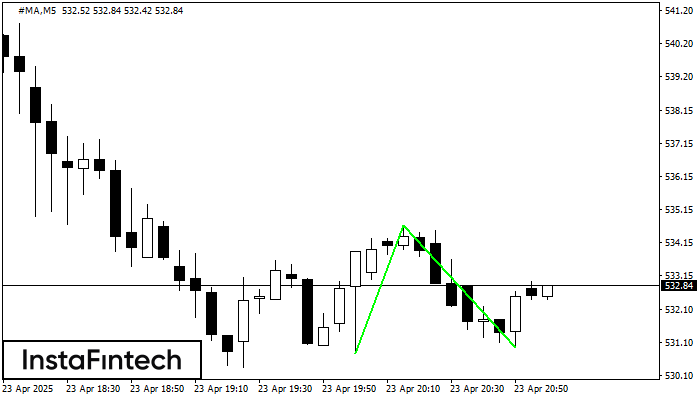
Pola Bawah Ganda telah terbentuk pada #MA M5. Formasi ini mensinyalkan reversal tren dari arah penurunan ke arah kenaikan. Sinyal menunjukkan bahwa transaksi beli harus dibuka setelah batas atas pola
Rangka waktu M5 dan M15 mungkin memiliki lebih dari titik entri yang keliru.
Open chart in a new window
Panji Bullish
was formed on 23.04 at 20:00:19 (UTC+0)
signal strength 3 of 5
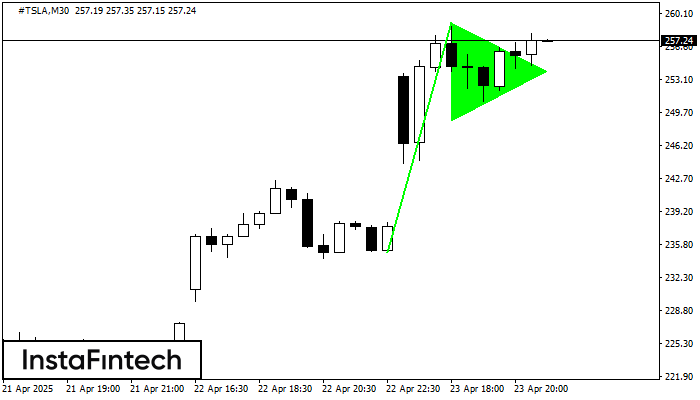
Pola grafik Panji Bullish telah terbentuk di instrumen #TSLA M30. Jenis pola ini terjadi pada kategori pola kelanjutan. Dalam kasus ini, jika kuotasi dapat menembus titik tertinggi, harga diperkirakan akan
Open chart in a new window


