

Pola sebenarnya

Triple Bottom
was formed on 02.04 at 04:15:26 (UTC+0)
signal strength 2 of 5
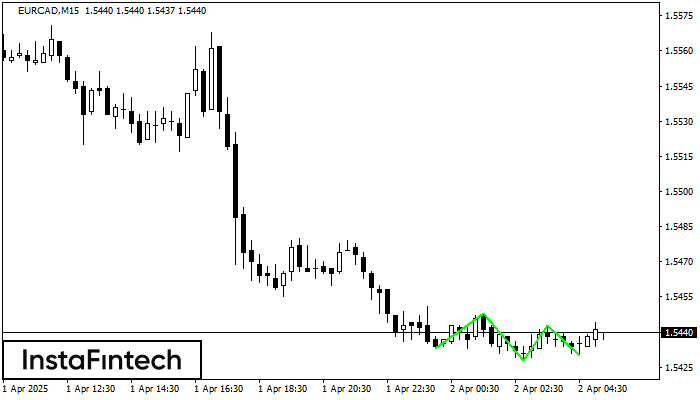
The Triple Bottom pattern has formed on the chart of the EURCAD M15 trading instrument. The pattern signals a change in the trend from downwards to upwards in the case of breakdown of 1.5448/1.5443.
The M5 and M15 time frames may have more false entry points.
Lihat juga
- All
- All
- Bearish Rectangle
- Bearish Symmetrical Triangle
- Bearish Symmetrical Triangle
- Bullish Rectangle
- Double Top
- Double Top
- Triple Bottom
- Triple Bottom
- Triple Top
- Triple Top
- All
- All
- Buy
- Sale
- All
- 1
- 2
- 3
- 4
- 5
Double Top
was formed on 07.04 at 13:00:13 (UTC+0)
signal strength 1 of 5
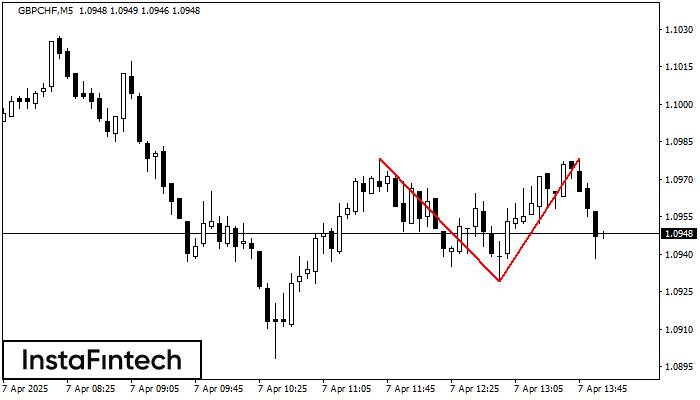
The Double Top reversal pattern has been formed on GBPCHF M5. Characteristics: the upper boundary 1.0978; the lower boundary 1.0929; the width of the pattern is 49 points. Sell trades
The M5 and M15 time frames may have more false entry points.
Open chart in a new window
Double Bottom
was formed on 07.04 at 13:00:00 (UTC+0)
signal strength 4 of 5
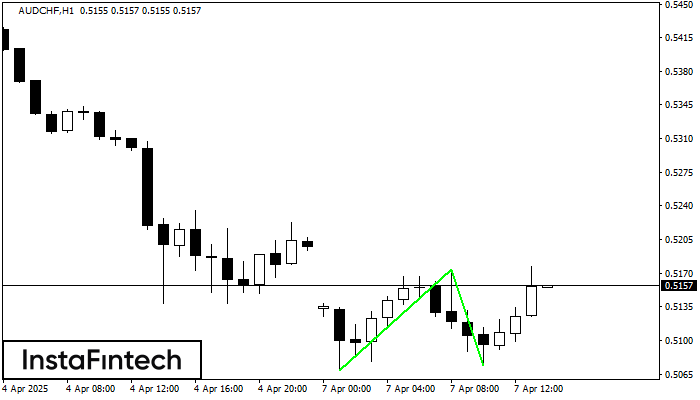
The Double Bottom pattern has been formed on AUDCHF H1; the upper boundary is 0.5174; the lower boundary is 0.5074. The width of the pattern is 105 points. In case
Open chart in a new window
Double Top
was formed on 07.04 at 12:59:43 (UTC+0)
signal strength 4 of 5
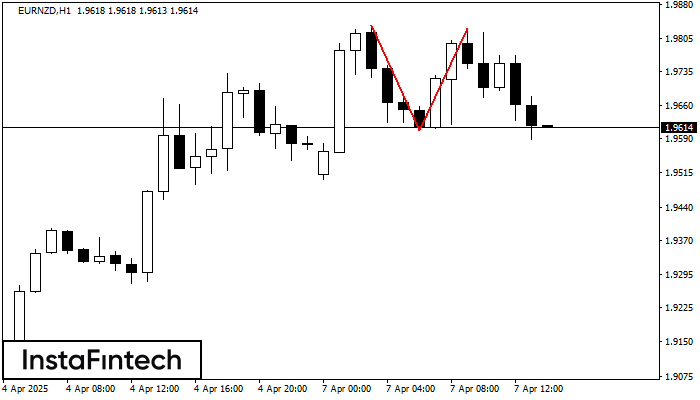
The Double Top reversal pattern has been formed on EURNZD H1. Characteristics: the upper boundary 1.9834; the lower boundary 1.9606; the width of the pattern is 222 points. Sell trades
Open chart in a new window


