

Pola sebenarnya

Bearish Symmetrical Triangle
was formed on 01.04 at 09:09:30 (UTC+0)
signal strength 3 of 5
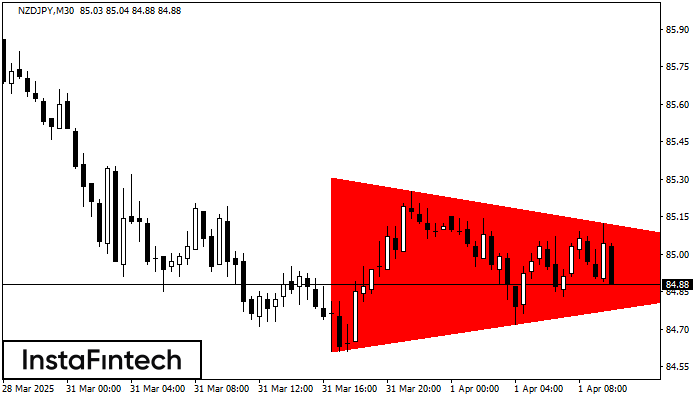
According to the chart of M30, NZDJPY formed the Bearish Symmetrical Triangle pattern. This pattern signals a further downward trend in case the lower border 84.61 is breached. Here, a hypothetical profit will equal the width of the available pattern that is -69 pips.
Lihat juga
- All
- All
- Bearish Rectangle
- Bearish Symmetrical Triangle
- Bearish Symmetrical Triangle
- Bullish Rectangle
- Double Top
- Double Top
- Triple Bottom
- Triple Bottom
- Triple Top
- Triple Top
- All
- All
- Buy
- Sale
- All
- 1
- 2
- 3
- 4
- 5
Persegi Bearish
was formed on 29.05 at 10:50:07 (UTC+0)
signal strength 1 of 5
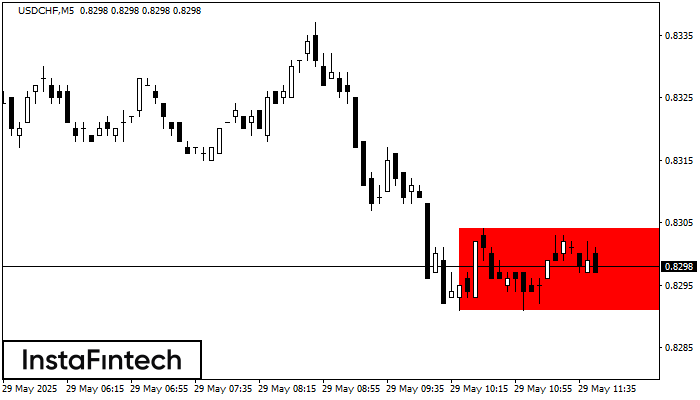
Menurut grafik dari M5, USDCHF terbentuk Persegi Bearish. Jenis pola ini menunjukkan kelanjutan tren. Terdiri dari dua tingkat: resistance 0.8304 - 0.0000 dan support 0.8291 – 0.8291. Jika level resistance
Rangka waktu M5 dan M15 mungkin memiliki lebih dari titik entri yang keliru.
Open chart in a new window
Bawah Ganda
was formed on 29.05 at 10:20:05 (UTC+0)
signal strength 1 of 5
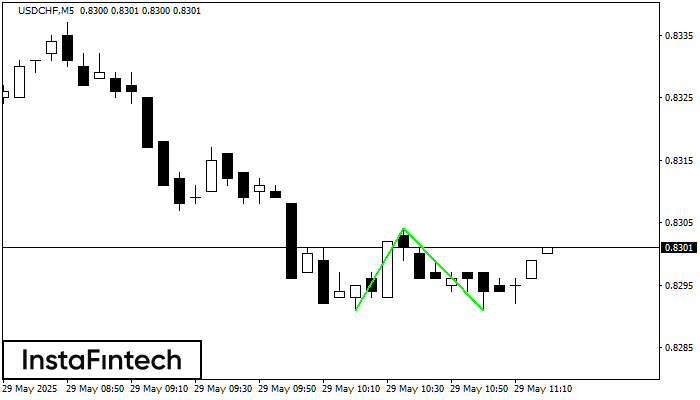
Pola Bawah Ganda telah terbentuk pada USDCHF M5; batas atas di 0.8304; batas bawah di 0.8291. Lebar pola sebesar 13 poin. Jika harga menembus batas atas 0.8304, Perubahan dalam tren
Rangka waktu M5 dan M15 mungkin memiliki lebih dari titik entri yang keliru.
Open chart in a new window
Kepala dan bahu
was formed on 29.05 at 09:45:24 (UTC+0)
signal strength 1 of 5
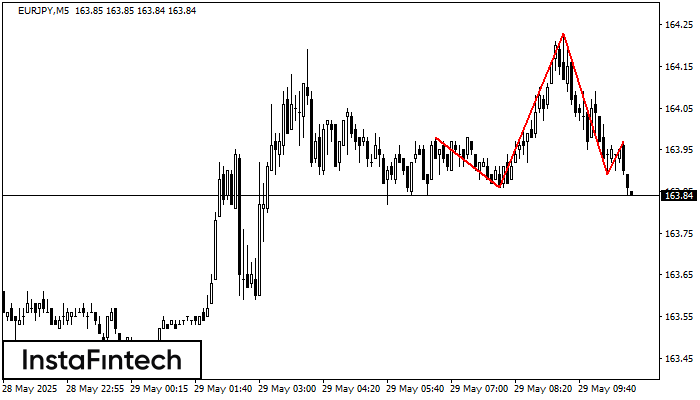
Menurut grafik M5, EURJPY membentuk pola Kepala dan bahu. Puncak The Head ditetapkan di 164.23 sementara garis median the Neck ditemukan di 163.86/163.89. Formasi pola Kepala dan bahu terbukti mensinyalkan
Rangka waktu M5 dan M15 mungkin memiliki lebih dari titik entri yang keliru.
Open chart in a new window


