

Pola sebenarnya

Double Top
was formed on 31.03 at 13:22:23 (UTC+0)
signal strength 1 of 5
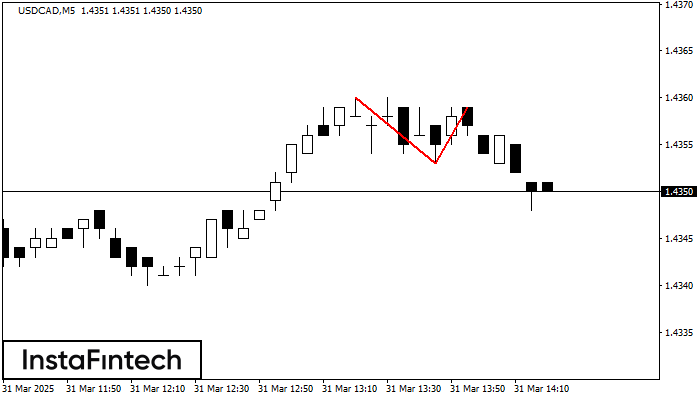
On the chart of USDCAD M5 the Double Top reversal pattern has been formed. Characteristics: the upper boundary 1.4359; the lower boundary 1.4353; the width of the pattern 6 points. The signal: a break of the lower boundary will cause continuation of the downward trend targeting the 1.4338 level.
The M5 and M15 time frames may have more false entry points.
- All
- All
- Bearish Rectangle
- Bearish Symmetrical Triangle
- Bearish Symmetrical Triangle
- Bullish Rectangle
- Double Top
- Double Top
- Triple Bottom
- Triple Bottom
- Triple Top
- Triple Top
- All
- All
- Buy
- Sale
- All
- 1
- 2
- 3
- 4
- 5
डबल टॉप
was formed on 23.04 at 04:00:20 (UTC+0)
signal strength 2 of 5
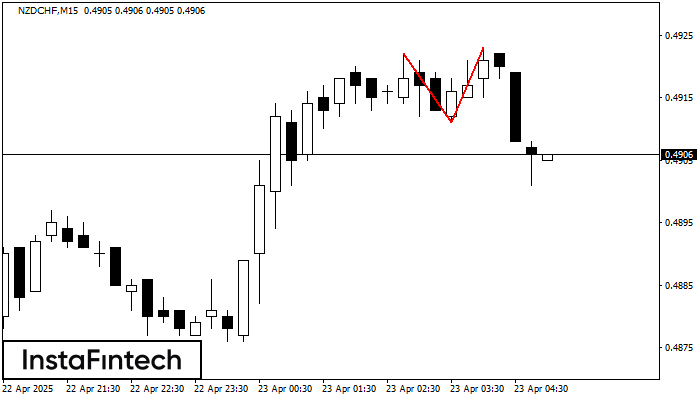
डबल टॉप पैटर्न NZDCHF M15 पर बना है। यह संकेत देता है कि प्रवृत्ति ऊपर से नीचे की ओर बदल गई है। संभवतः, यदि 0.4911 पैटर्न का आधार टूट जाता
M5 और M15 समय सीमा में अधिक फाल्स एंट्री पॉइंट्स हो सकते हैं।
Open chart in a new window
डबल बॉटम
was formed on 23.04 at 03:45:13 (UTC+0)
signal strength 2 of 5
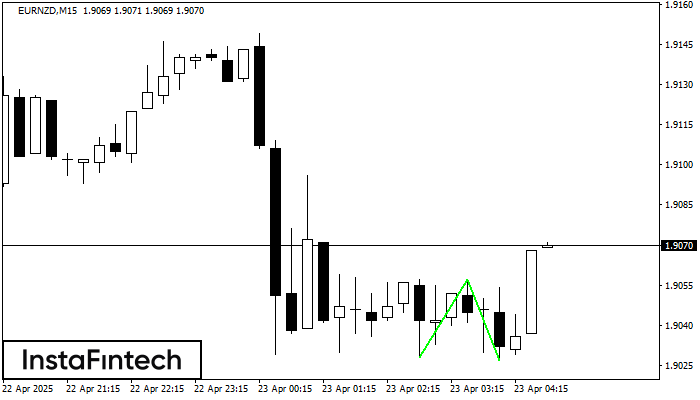
डबल बॉटम पैटर्न EURNZD M15 पर बना है; ऊपरी सीमा 1.9057 है; निचली सीमा 1.9027 है। पैटर्न की चौड़ाई 29 अंक है। ऊपरी सीमा 1.9057 के टूटने के मामले में
M5 और M15 समय सीमा में अधिक फाल्स एंट्री पॉइंट्स हो सकते हैं।
Open chart in a new window
डबल टॉप
was formed on 23.04 at 03:35:42 (UTC+0)
signal strength 1 of 5
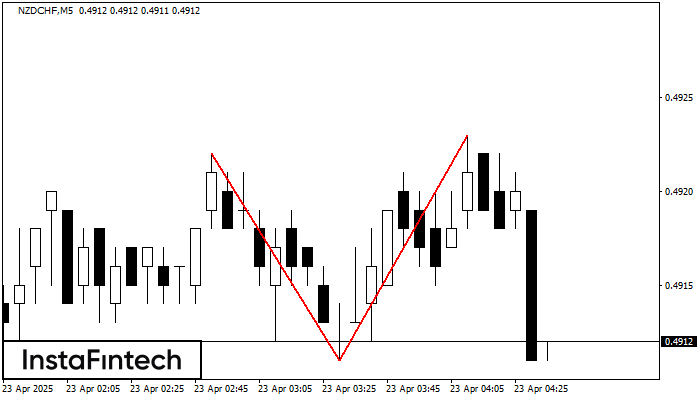
NZDCHF M5 पर डबल टॉप रीवर्सल पैटर्न बना है। विशेषताएं: ऊपरी सीमा 0.4922; निचली सीमा 0.4911; पैटर्न की चौड़ाई 12 पॉइंट्स है। सेल ट्रेडों को 0.4911 की निचली सीमा के
M5 और M15 समय सीमा में अधिक फाल्स एंट्री पॉइंट्स हो सकते हैं।
Open chart in a new window


