

Pola sebenarnya

Triple Bottom
was formed on 31.03 at 13:00:03 (UTC+0)
signal strength 3 of 5
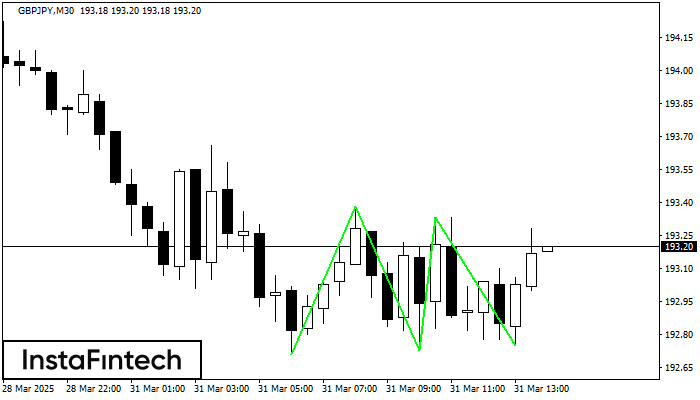
The Triple Bottom pattern has been formed on GBPJPY M30. It has the following characteristics: resistance level 193.38/193.33; support level 192.71/192.75; the width is 67 points. In the event of a breakdown of the resistance level of 193.38, the price is likely to continue an upward movement at least to 193.03.
Lihat juga
- All
- All
- Bearish Rectangle
- Bearish Symmetrical Triangle
- Bearish Symmetrical Triangle
- Bullish Rectangle
- Double Top
- Double Top
- Triple Bottom
- Triple Bottom
- Triple Top
- Triple Top
- All
- All
- Buy
- Sale
- All
- 1
- 2
- 3
- 4
- 5
Head and Shoulders
was formed on 14.05 at 15:30:27 (UTC+0)
signal strength 3 of 5
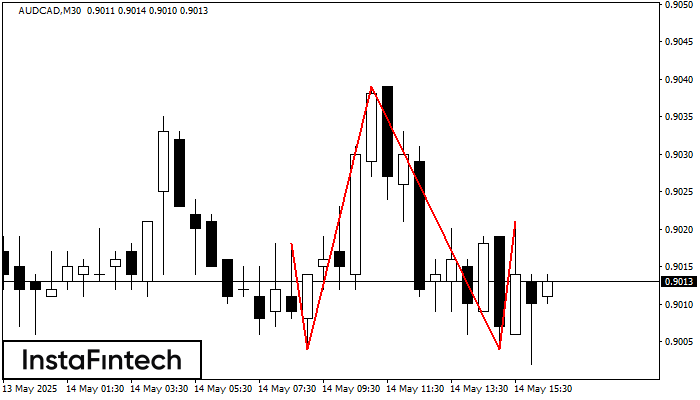
The AUDCAD M30 formed the Head and Shoulders pattern with the following features: The Head’s top is at 0.9039, the Neckline and the upward angle are at 0.9004/0.9004. The formation
Open chart in a new window
Bearish Flag
was formed on 14.05 at 15:29:48 (UTC+0)
signal strength 1 of 5
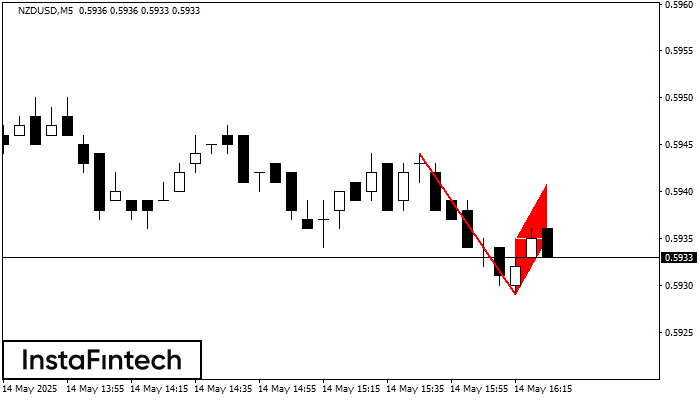
The Bearish Flag pattern has been formed on the chart NZDUSD M5. Therefore, the downwards trend is likely to continue in the nearest term. As soon as the price breaks
The M5 and M15 time frames may have more false entry points.
Open chart in a new window
Bearish pennant
was formed on 14.05 at 15:29:42 (UTC+0)
signal strength 1 of 5
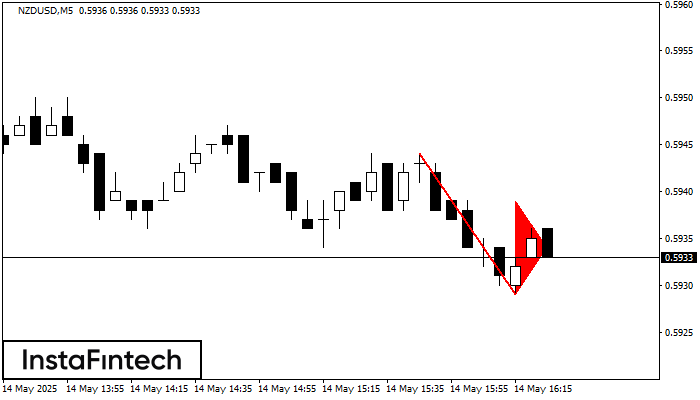
The Bearish pennant pattern has formed on the NZDUSD M5 chart. The pattern signals continuation of the downtrend in case the pennant’s low of 0.5929 is broken through. Recommendations: Place
The M5 and M15 time frames may have more false entry points.
Open chart in a new window


