

Pola sebenarnya

Double Bottom
was formed on 31.03 at 11:30:28 (UTC+0)
signal strength 2 of 5
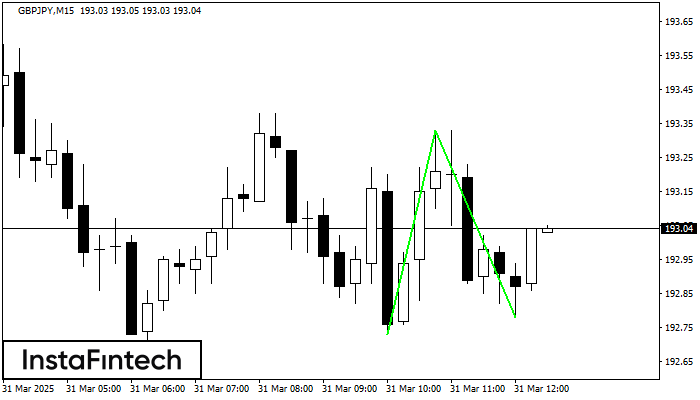
The Double Bottom pattern has been formed on GBPJPY M15; the upper boundary is 193.33; the lower boundary is 192.78. The width of the pattern is 60 points. In case of a break of the upper boundary 193.33, a change in the trend can be predicted where the width of the pattern will coincide with the distance to a possible take profit level.
The M5 and M15 time frames may have more false entry points.
Lihat juga
- All
- All
- Bearish Rectangle
- Bearish Symmetrical Triangle
- Bearish Symmetrical Triangle
- Bullish Rectangle
- Double Top
- Double Top
- Triple Bottom
- Triple Bottom
- Triple Top
- Triple Top
- All
- All
- Buy
- Sale
- All
- 1
- 2
- 3
- 4
- 5
Teratas Ganda
was formed on 26.05 at 02:30:39 (UTC+0)
signal strength 3 of 5
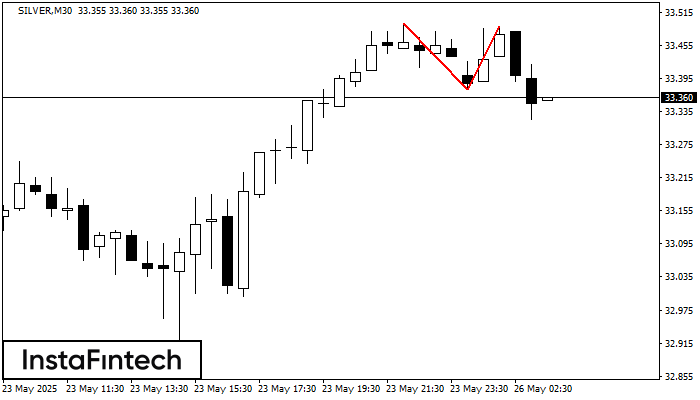
Pola Teratas Ganda telah terbentuk pada SILVER M30. Pola ini menandakan bahwa tren telah berubah dari kenaikan menjadi penurunan. Mungkin, jika dasar pola di 33.38 ditembus, maka pergerakan menurun akan
Open chart in a new window
Bawah Ganda
was formed on 26.05 at 02:30:11 (UTC+0)
signal strength 3 of 5
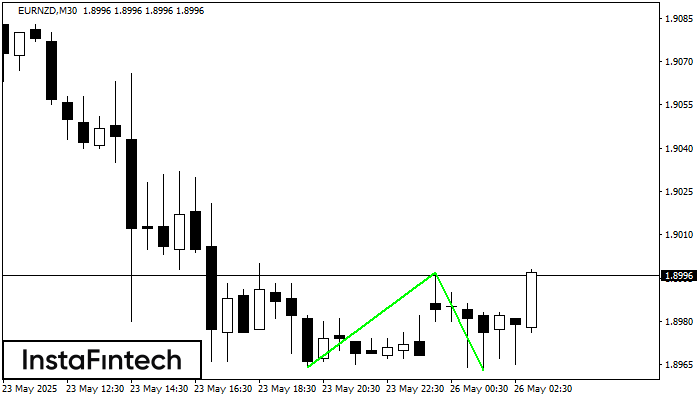
Pola Bawah Ganda telah terbentuk pada EURNZD M30. Karakteristik: level support 1.8964; level resistance 1.8997; lebar pola 33 poin. Jika level resistance ditembus, perubahan dalam tren dapat diprediksi dengan target
Open chart in a new window
Teratas Ganda
was formed on 26.05 at 02:00:51 (UTC+0)
signal strength 2 of 5
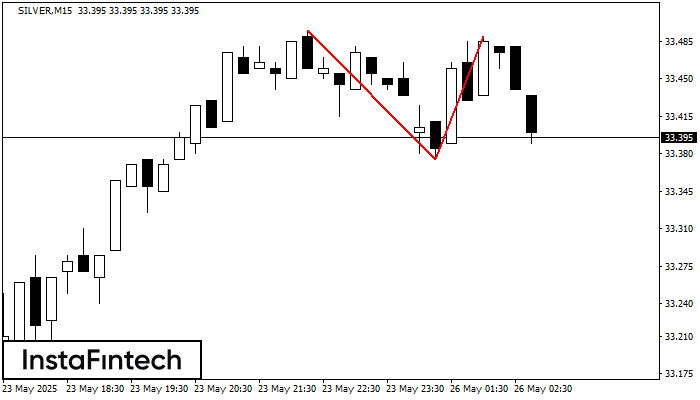
Pada grafik SILVER M15 pola reversal Teratas Ganda telah terbentuk. Karakteristik: batas atas 33.49; batas bawah 33.38; lebar pola 115 poin. Sinyal: tembusan ke batas bawah akan menyebabkan kelanjutan tren
Rangka waktu M5 dan M15 mungkin memiliki lebih dari titik entri yang keliru.
Open chart in a new window


