

Pola sebenarnya

Double Bottom
was formed on 31.03 at 00:50:23 (UTC+0)
signal strength 1 of 5
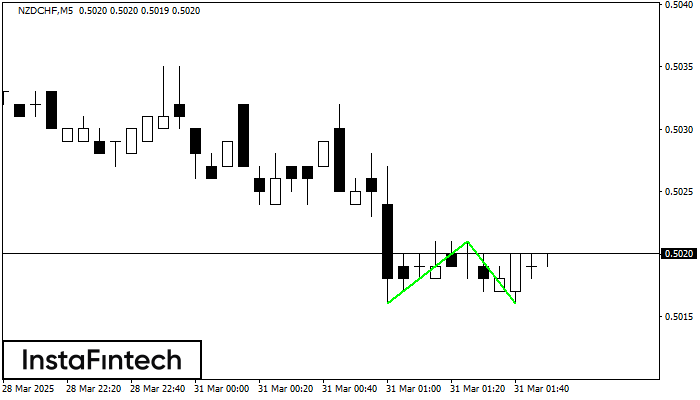
The Double Bottom pattern has been formed on NZDCHF M5; the upper boundary is 0.5021; the lower boundary is 0.5016. The width of the pattern is 5 points. In case of a break of the upper boundary 0.5021, a change in the trend can be predicted where the width of the pattern will coincide with the distance to a possible take profit level.
The M5 and M15 time frames may have more false entry points.
- All
- All
- Bearish Rectangle
- Bearish Symmetrical Triangle
- Bearish Symmetrical Triangle
- Bullish Rectangle
- Double Top
- Double Top
- Triple Bottom
- Triple Bottom
- Triple Top
- Triple Top
- All
- All
- Buy
- Sale
- All
- 1
- 2
- 3
- 4
- 5
Bullish Symmetrical Triangle
сформирован 06.06 в 06:31:05 (UTC+0)
сила сигнала 3 из 5
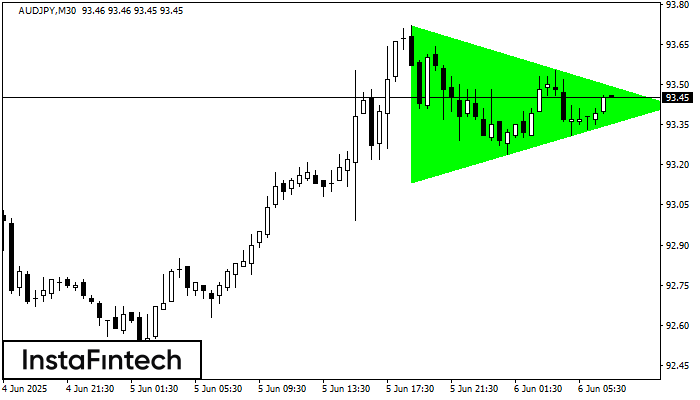
According to the chart of M30, AUDJPY formed the Bullish Symmetrical Triangle pattern. Description: This is the pattern of a trend continuation. 93.72 and 93.14 are the coordinates
Открыть график инструмента в новом окне
Double Top
сформирован 06.06 в 06:06:16 (UTC+0)
сила сигнала 1 из 5
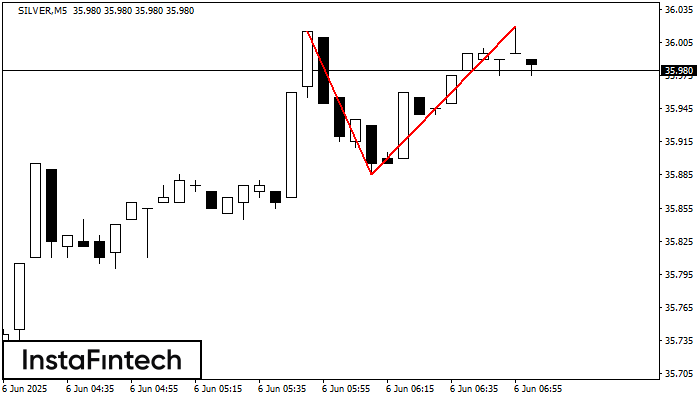
The Double Top pattern has been formed on SILVER M5. It signals that the trend has been changed from upwards to downwards. Probably, if the base of the pattern 35.88
The M5 and M15 time frames may have more false entry points.
Открыть график инструмента в новом окне
Bullish Symmetrical Triangle
сформирован 06.06 в 05:43:54 (UTC+0)
сила сигнала 2 из 5
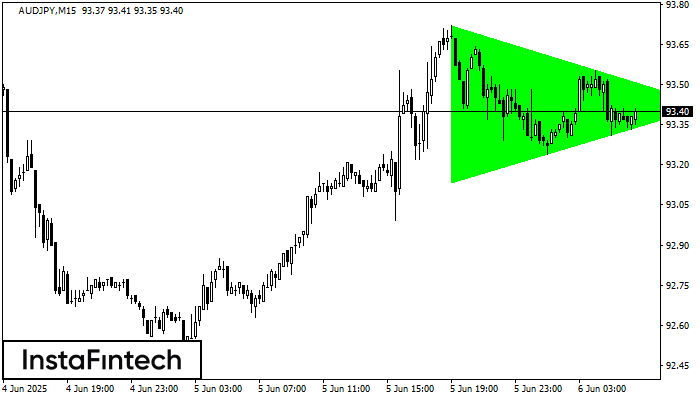
According to the chart of M15, AUDJPY formed the Bullish Symmetrical Triangle pattern, which signals the trend will continue. Description. The upper border of the pattern touches the coordinates 93.72/93.42
The M5 and M15 time frames may have more false entry points.
Открыть график инструмента в новом окне


