

Pola sebenarnya

Triple Top
was formed on 30.03 at 23:45:26 (UTC+0)
signal strength 2 of 5
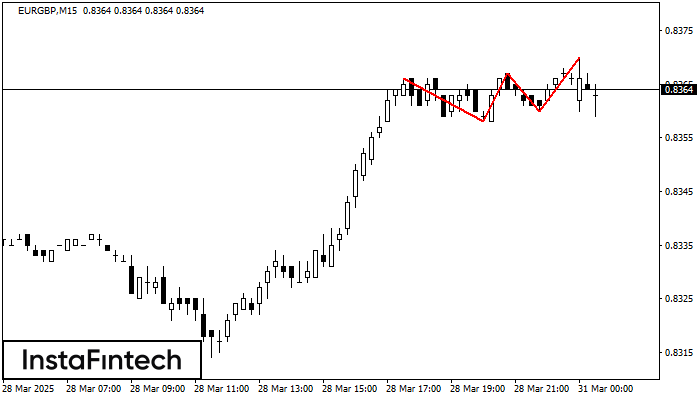
The Triple Top pattern has formed on the chart of the EURGBP M15. Features of the pattern: borders have an ascending angle; the lower line of the pattern has the coordinates 0.8358/0.8360 with the upper limit 0.8366/0.8370; the projection of the width is 8 points. The formation of the Triple Top figure most likely indicates a change in the trend from upward to downward. This means that in the event of a breakdown of the support level of 0.8358, the price is most likely to continue the downward movement.
The M5 and M15 time frames may have more false entry points.
- All
- All
- Bearish Rectangle
- Bearish Symmetrical Triangle
- Bearish Symmetrical Triangle
- Bullish Rectangle
- Double Top
- Double Top
- Triple Bottom
- Triple Bottom
- Triple Top
- Triple Top
- All
- All
- Buy
- Sale
- All
- 1
- 2
- 3
- 4
- 5
Bearish Flag
was formed on 14.05 at 16:32:33 (UTC+0)
signal strength 1 of 5

The Bearish Flag pattern has been formed on GOLD at M5. The lower boundary of the pattern is located at 3177.35/3185.07 while the upper boundary lies at 3185.27/3192.99. The projection
The M5 and M15 time frames may have more false entry points.
Open chart in a new window
Bearish pennant
was formed on 14.05 at 16:32:28 (UTC+0)
signal strength 1 of 5
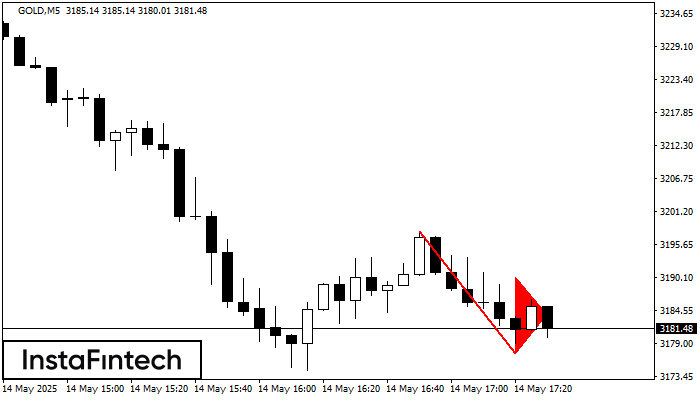
The Bearish pennant pattern has formed on the GOLD M5 chart. The pattern signals continuation of the downtrend in case the pennant’s low of 3177.35 is broken through. Recommendations: Place
The M5 and M15 time frames may have more false entry points.
Open chart in a new window
Bearish pennant
was formed on 14.05 at 16:31:58 (UTC+0)
signal strength 1 of 5
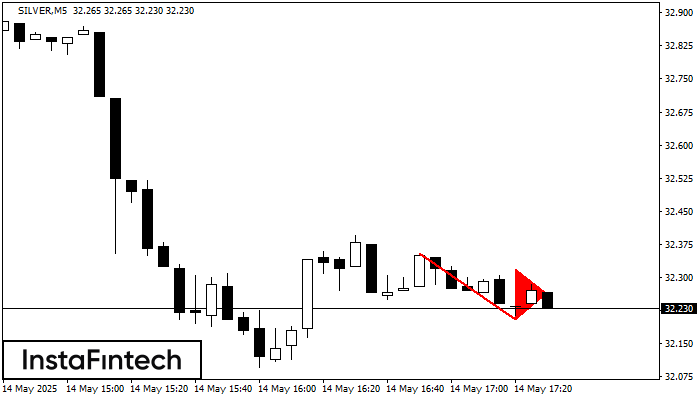
The Bearish pennant pattern has formed on the SILVER M5 chart. This pattern type is characterized by a slight slowdown after which the price will move in the direction
The M5 and M15 time frames may have more false entry points.
Open chart in a new window


