

Pola sebenarnya

Inverse Head and Shoulder
was formed on 27.03 at 09:00:09 (UTC+0)
signal strength 3 of 5
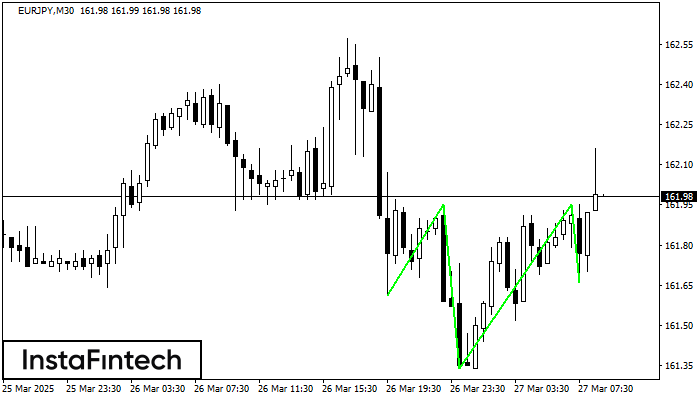
According to M30, EURJPY is shaping the technical pattern – the Inverse Head and Shoulder. In case the Neckline 161.95/161.95 is broken out, the instrument is likely to move toward 162.25.
- All
- All
- Bearish Rectangle
- Bearish Symmetrical Triangle
- Bearish Symmetrical Triangle
- Bullish Rectangle
- Double Top
- Double Top
- Triple Bottom
- Triple Bottom
- Triple Top
- Triple Top
- All
- All
- Buy
- Sale
- All
- 1
- 2
- 3
- 4
- 5
Bearish Rectangle
was formed on 17.04 at 01:12:52 (UTC+0)
signal strength 1 of 5
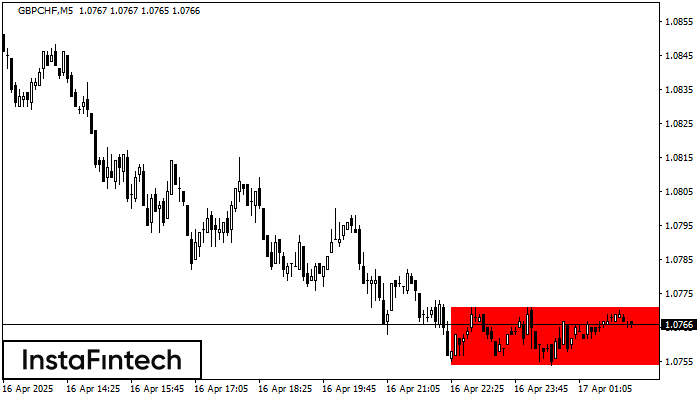
According to the chart of M5, GBPCHF formed the Bearish Rectangle. The pattern indicates a trend continuation. The upper border is 1.0771, the lower border is 1.0754. The signal means
The M5 and M15 time frames may have more false entry points.
Open chart in a new window
Bearish Rectangle
was formed on 17.04 at 01:06:37 (UTC+0)
signal strength 1 of 5
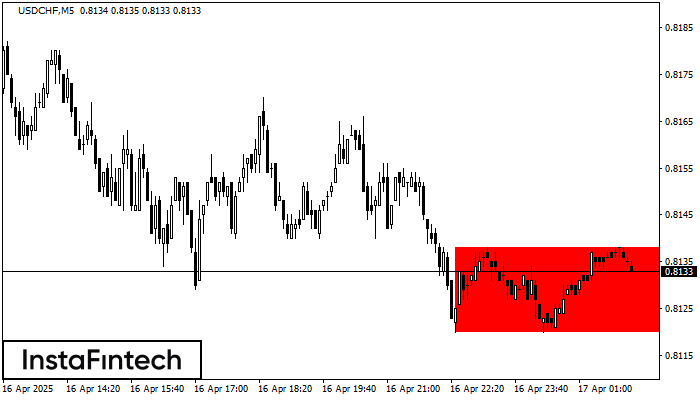
According to the chart of M5, USDCHF formed the Bearish Rectangle. The pattern indicates a trend continuation. The upper border is 0.8138, the lower border is 0.8120. The signal means
The M5 and M15 time frames may have more false entry points.
Open chart in a new window
Bullish Symmetrical Triangle
was formed on 17.04 at 01:00:11 (UTC+0)
signal strength 1 of 5

According to the chart of M5, GBPUSD formed the Bullish Symmetrical Triangle pattern. Description: This is the pattern of a trend continuation. 1.3248 and 1.3228 are the coordinates
The M5 and M15 time frames may have more false entry points.
Open chart in a new window


