

Pola sebenarnya

Inverse Head and Shoulder
was formed on 27.03 at 03:05:48 (UTC+0)
signal strength 1 of 5

According to the chart of M5, NZDUSD formed the Inverse Head and Shoulder pattern. The Head’s top is set at 0.5723 while the median line of the Neck is found at 0.5705/0.5719. The formation of the Inverse Head and Shoulder pattern evidently signals a reversal of the downward trend. In other words, in case the scenario comes true, the price of NZDUSD will go towards 0.5738
The M5 and M15 time frames may have more false entry points.
Lihat juga
- All
- All
- Bearish Rectangle
- Bearish Symmetrical Triangle
- Bearish Symmetrical Triangle
- Bullish Rectangle
- Double Top
- Double Top
- Triple Bottom
- Triple Bottom
- Triple Top
- Triple Top
- All
- All
- Buy
- Sale
- All
- 1
- 2
- 3
- 4
- 5
Bullish Flag
was formed on 30.05 at 05:44:52 (UTC+0)
signal strength 2 of 5
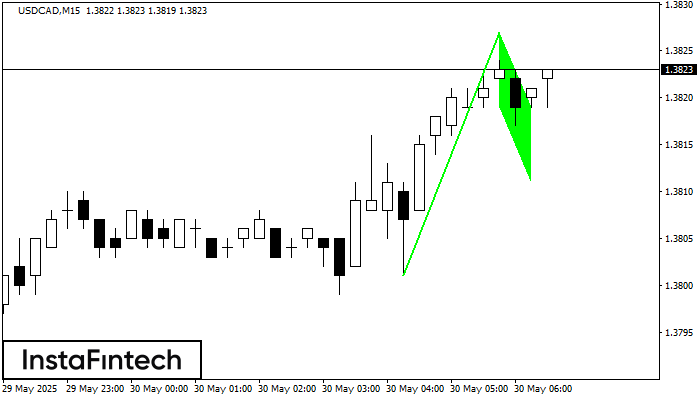
The Bullish Flag pattern which signals continuation of a trend has been formed on the chart USDCAD M15. Forecast: if the price breaks above the pattern high at 1.3827, then
The M5 and M15 time frames may have more false entry points.
Open chart in a new window
Bullish pennant
was formed on 30.05 at 05:44:46 (UTC+0)
signal strength 2 of 5
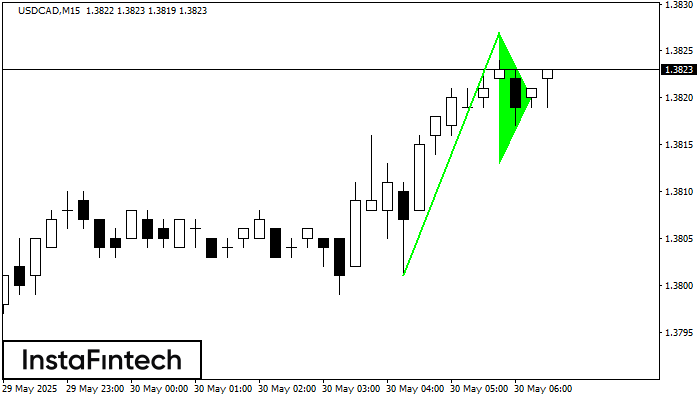
The Bullish pennant signal – Trading instrument USDCAD M15, continuation pattern. Forecast: it is possible to set up a buy position above the pattern’s high of 1.3827, with the prospect
The M5 and M15 time frames may have more false entry points.
Open chart in a new window
Bearish Flag
was formed on 30.05 at 05:31:16 (UTC+0)
signal strength 2 of 5
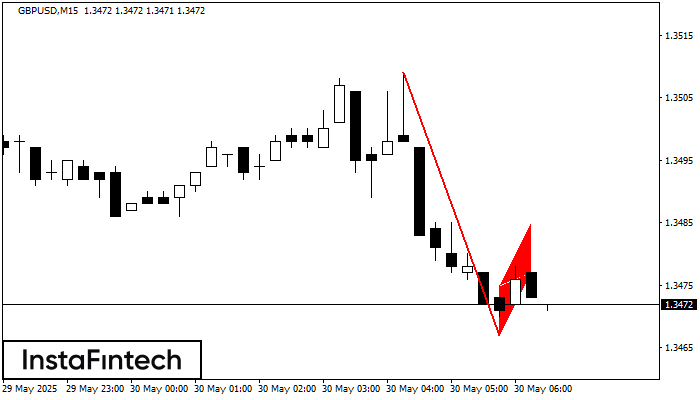
The Bearish Flag pattern has been formed on the chart GBPUSD M15 which signals that the downward trend will continue. If the price breaks below the low at 1.3467, then
The M5 and M15 time frames may have more false entry points.
Open chart in a new window


