

Pola sebenarnya

Double Top
was formed on 26.03 at 10:30:57 (UTC+0)
signal strength 3 of 5
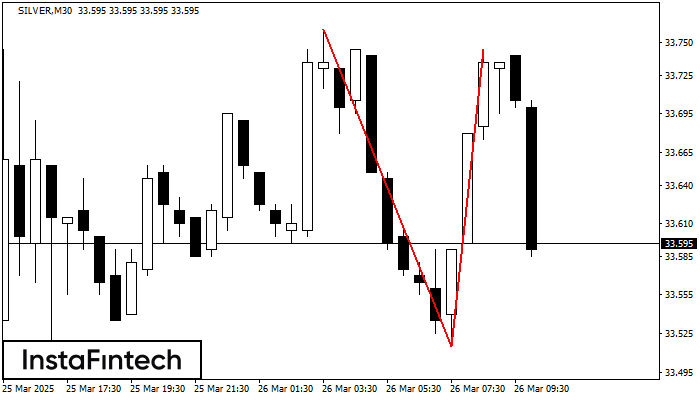
On the chart of SILVER M30 the Double Top reversal pattern has been formed. Characteristics: the upper boundary 33.74; the lower boundary 33.52; the width of the pattern 230 points. The signal: a break of the lower boundary will cause continuation of the downward trend targeting the 33.48 level.
- All
- All
- Bearish Rectangle
- Bearish Symmetrical Triangle
- Bearish Symmetrical Triangle
- Bullish Rectangle
- Double Top
- Double Top
- Triple Bottom
- Triple Bottom
- Triple Top
- Triple Top
- All
- All
- Buy
- Sale
- All
- 1
- 2
- 3
- 4
- 5
Bullish Symmetrical Triangle
was formed on 28.05 at 17:35:33 (UTC+0)
signal strength 1 of 5
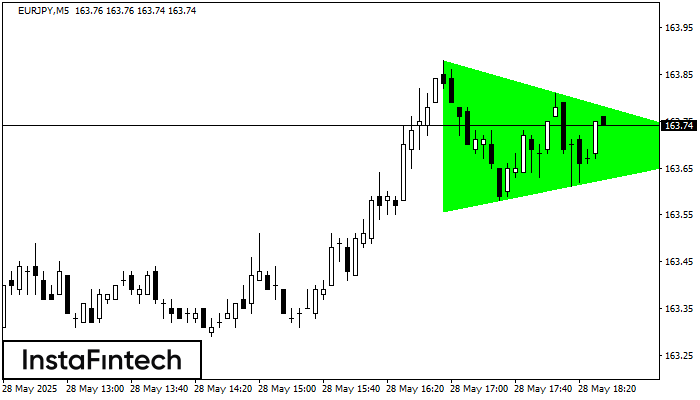
According to the chart of M5, EURJPY formed the Bullish Symmetrical Triangle pattern. Description: This is the pattern of a trend continuation. 163.88 and 163.56 are the coordinates
The M5 and M15 time frames may have more false entry points.
Open chart in a new window
Double Bottom
was formed on 28.05 at 17:35:28 (UTC+0)
signal strength 1 of 5
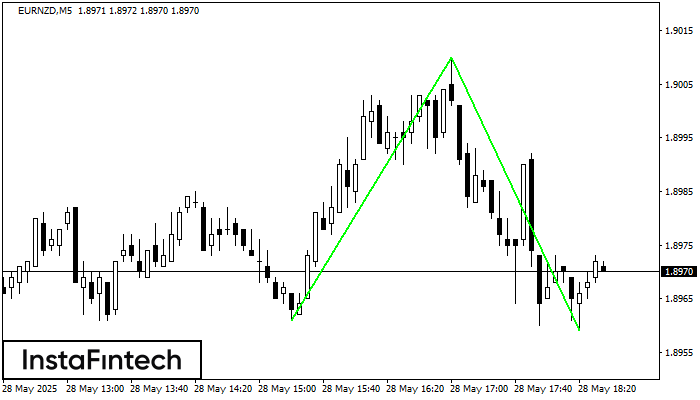
The Double Bottom pattern has been formed on EURNZD M5; the upper boundary is 1.9010; the lower boundary is 1.8959. The width of the pattern is 49 points. In case
The M5 and M15 time frames may have more false entry points.
Open chart in a new window
Double Bottom
was formed on 28.05 at 17:20:09 (UTC+0)
signal strength 1 of 5
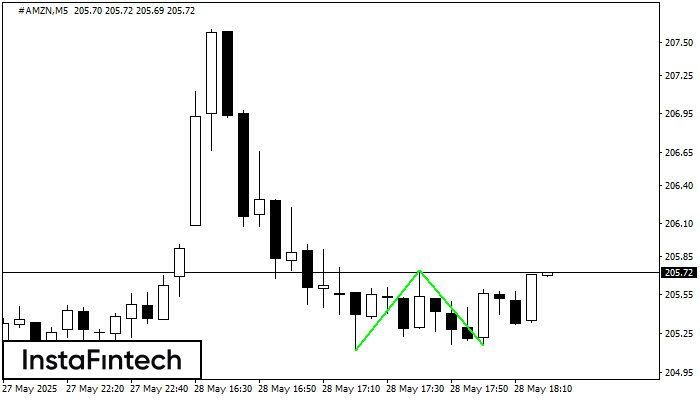
The Double Bottom pattern has been formed on #AMZN M5; the upper boundary is 205.74; the lower boundary is 205.16. The width of the pattern is 62 points. In case
The M5 and M15 time frames may have more false entry points.
Open chart in a new window


