

Pola sebenarnya

Bearish Rectangle
was formed on 24.03 at 22:46:30 (UTC+0)
signal strength 3 of 5
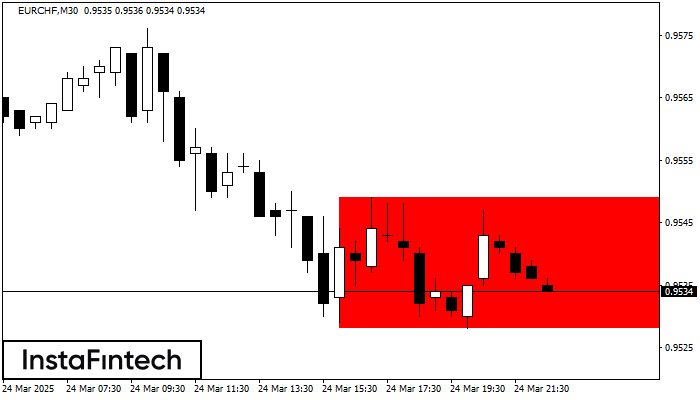
According to the chart of M30, EURCHF formed the Bearish Rectangle. This type of a pattern indicates a trend continuation. It consists of two levels: resistance 0.9549 - 0.0000 and support 0.9528 – 0.9528. In case the resistance level 0.9528 - 0.9528 is broken, the instrument is likely to follow the bearish trend.
Lihat juga
- All
- All
- Bearish Rectangle
- Bearish Symmetrical Triangle
- Bearish Symmetrical Triangle
- Bullish Rectangle
- Double Top
- Double Top
- Triple Bottom
- Triple Bottom
- Triple Top
- Triple Top
- All
- All
- Buy
- Sale
- All
- 1
- 2
- 3
- 4
- 5
Тройное дно
сформирован 30.05 в 20:25:24 (UTC+0)
сила сигнала 1 из 5
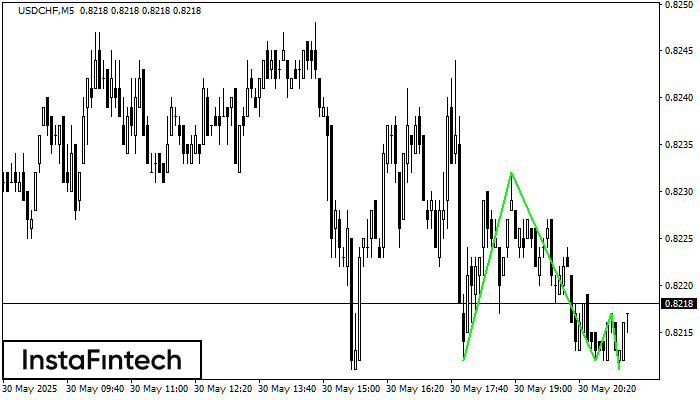
Сформирована фигура «Тройное дно» по торговому инструменту USDCHF на M5. Фигура сигнализирует об изменении тенденции с нисходящей на восходящую в случае пробоя верхней границы 0.8217
Таймфреймы М5 и М15 могут иметь больше ложных точек входа.
Открыть график инструмента в новом окне
Двойное дно
сформирован 30.05 в 20:10:20 (UTC+0)
сила сигнала 1 из 5
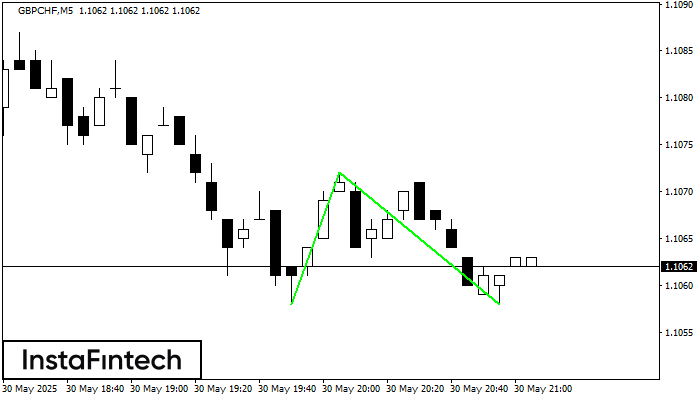
Сформирована фигура «Двойное дно» на графике GBPCHF M5. Данное формирование сигнализирует об изменении тенденции с нисходящего на восходящее движение. Сигнал: Торговую позицию на покупку следует открывать после пробоя верхней границы
Таймфреймы М5 и М15 могут иметь больше ложных точек входа.
Открыть график инструмента в новом окне
Медвежий симметричный треугольник
сформирован 30.05 в 20:06:13 (UTC+0)
сила сигнала 1 из 5
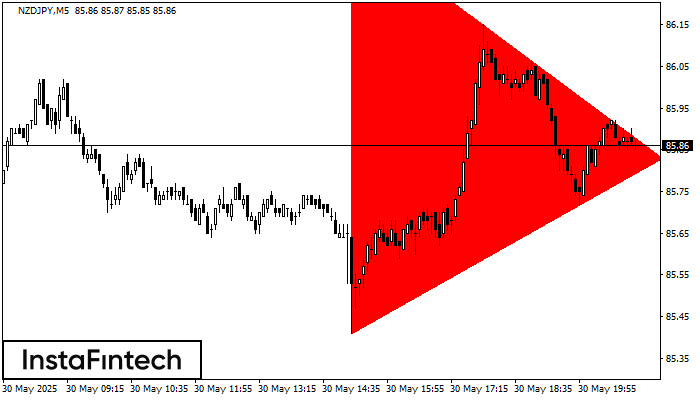
На графике NZDJPY M5 сформировалась фигура «Медвежий симметричный треугольник». Характеристика фигуры: Нижняя граница 85.41/85.83; Верхняя граница 86.39/85.83; Проекция ширины фигуры -98 пунктов. Формирование фигуры «Медвежий симметричный треугольник» наиболее вероятным образом
Таймфреймы М5 и М15 могут иметь больше ложных точек входа.
Открыть график инструмента в новом окне


