

Pola sebenarnya

Bearish Rectangle
was formed on 21.03 at 15:03:03 (UTC+0)
signal strength 3 of 5
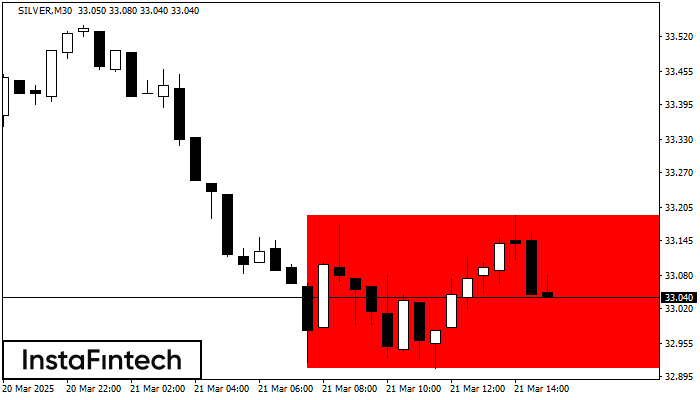
According to the chart of M30, SILVER formed the Bearish Rectangle. The pattern indicates a trend continuation. The upper border is 33.19, the lower border is 32.91. The signal means that a short position should be opened after fixing a price below the lower border 32.91 of the Bearish Rectangle.
- All
- All
- Bearish Rectangle
- Bearish Symmetrical Triangle
- Bearish Symmetrical Triangle
- Bullish Rectangle
- Double Top
- Double Top
- Triple Bottom
- Triple Bottom
- Triple Top
- Triple Top
- All
- All
- Buy
- Sale
- All
- 1
- 2
- 3
- 4
- 5
Bullish Symmetrical Triangle
сформирован 28.05 в 18:05:32 (UTC+0)
сила сигнала 1 из 5
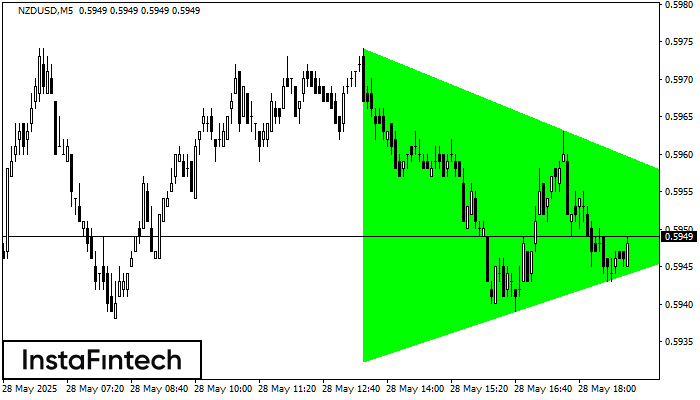
According to the chart of M5, NZDUSD formed the Bullish Symmetrical Triangle pattern. Description: This is the pattern of a trend continuation. 0.5974 and 0.5932 are the coordinates
The M5 and M15 time frames may have more false entry points.
Открыть график инструмента в новом окне
Bearish Rectangle
сформирован 28.05 в 17:36:39 (UTC+0)
сила сигнала 1 из 5
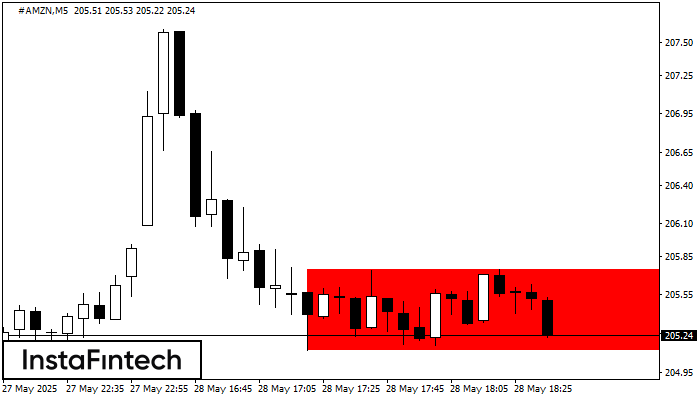
According to the chart of M5, #AMZN formed the Bearish Rectangle. This type of a pattern indicates a trend continuation. It consists of two levels: resistance 205.75 - 0.00
The M5 and M15 time frames may have more false entry points.
Открыть график инструмента в новом окне
Bullish Symmetrical Triangle
сформирован 28.05 в 17:35:33 (UTC+0)
сила сигнала 1 из 5
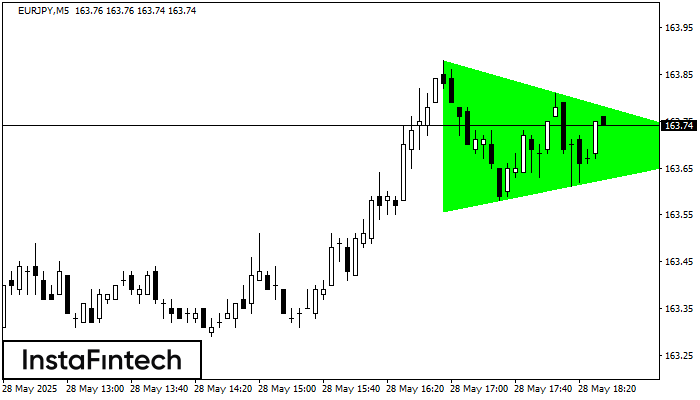
According to the chart of M5, EURJPY formed the Bullish Symmetrical Triangle pattern. Description: This is the pattern of a trend continuation. 163.88 and 163.56 are the coordinates
The M5 and M15 time frames may have more false entry points.
Открыть график инструмента в новом окне


