

Pola sebenarnya

Bullish Symmetrical Triangle
was formed on 19.03 at 18:02:02 (UTC+0)
signal strength 3 of 5
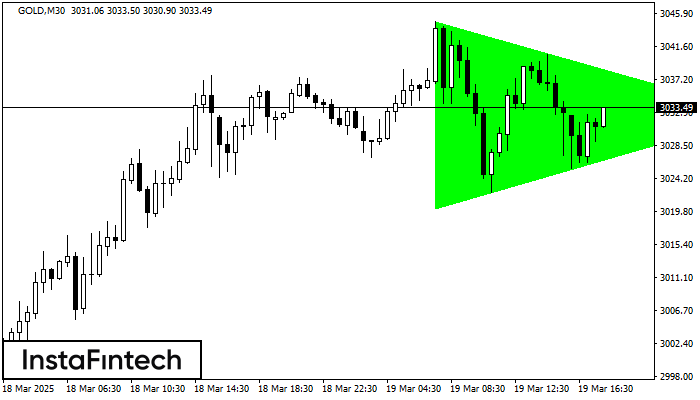
According to the chart of M30, GOLD formed the Bullish Symmetrical Triangle pattern, which signals the trend will continue. Description. The upper border of the pattern touches the coordinates 3044.87/3032.56 whereas the lower border goes across 3020.18/3032.56. The pattern width is measured on the chart at 2469 pips. If the Bullish Symmetrical Triangle pattern is in progress during the upward trend, this indicates the current trend will go on. In case 3032.56 is broken, the price could continue its move toward 3032.86.
Lihat juga
- All
- All
- Bearish Rectangle
- Bearish Symmetrical Triangle
- Bearish Symmetrical Triangle
- Bullish Rectangle
- Double Top
- Double Top
- Triple Bottom
- Triple Bottom
- Triple Top
- Triple Top
- All
- All
- Buy
- Sale
- All
- 1
- 2
- 3
- 4
- 5
Teratas Ganda
was formed on 13.08 at 10:30:11 (UTC+0)
signal strength 3 of 5
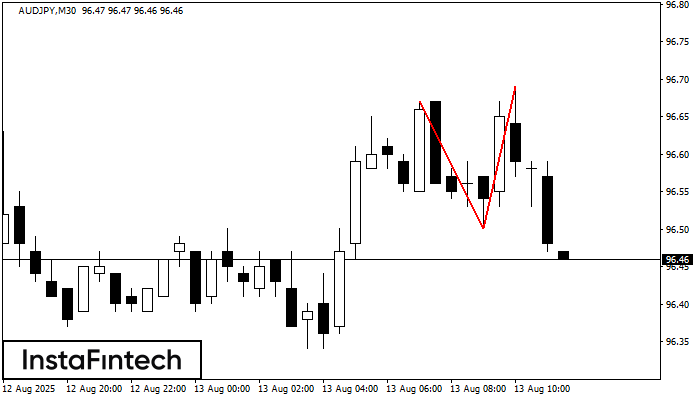
Pola Teratas Ganda telah terbentuk pada AUDJPY M30. Pola ini menandakan bahwa tren telah berubah dari kenaikan menjadi penurunan. Mungkin, jika dasar pola di 96.50 ditembus, maka pergerakan menurun akan
Open chart in a new window
Kepala dan bahu
was formed on 13.08 at 10:20:15 (UTC+0)
signal strength 1 of 5
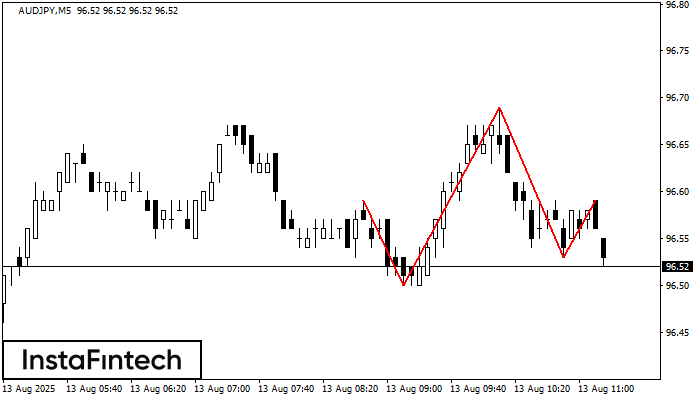
Pola teknikal yang disebut Kepala dan bahu telah muncul pada grafik AUDJPY M5. Terdapat banyak alasan untuk harga melewati Neckline 96.50/96.53 setelah Shoulder kanan terbentuk. Jadi, tren akan berubah dengan
Rangka waktu M5 dan M15 mungkin memiliki lebih dari titik entri yang keliru.
Open chart in a new window
Persegi Bullish
was formed on 13.08 at 07:48:16 (UTC+0)
signal strength 1 of 5
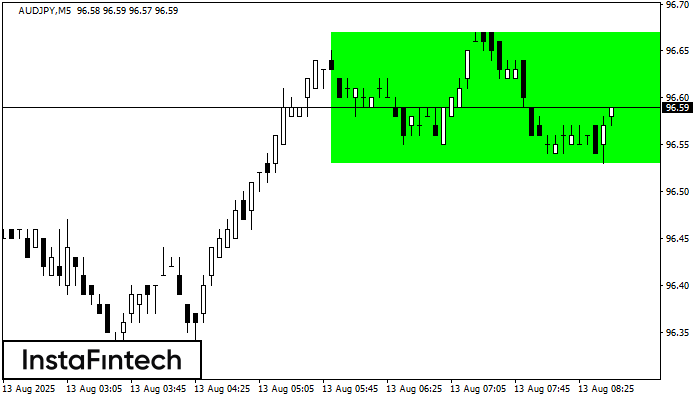
Menurut grafik dari M5, AUDJPY terbentuk Persegi Bullish. Pola menunjukkan kelanjutan tren. Batas atas adalah 96.67, batas lebih rendah adalah 96.53. Sinyal berarti posisi beli harus dibuka diatas batas atas
Rangka waktu M5 dan M15 mungkin memiliki lebih dari titik entri yang keliru.
Open chart in a new window


