empty
06.11.2023 06:04 PM
Technical analysis on Gold for November 6th, 2023.

This image is no longer relevant

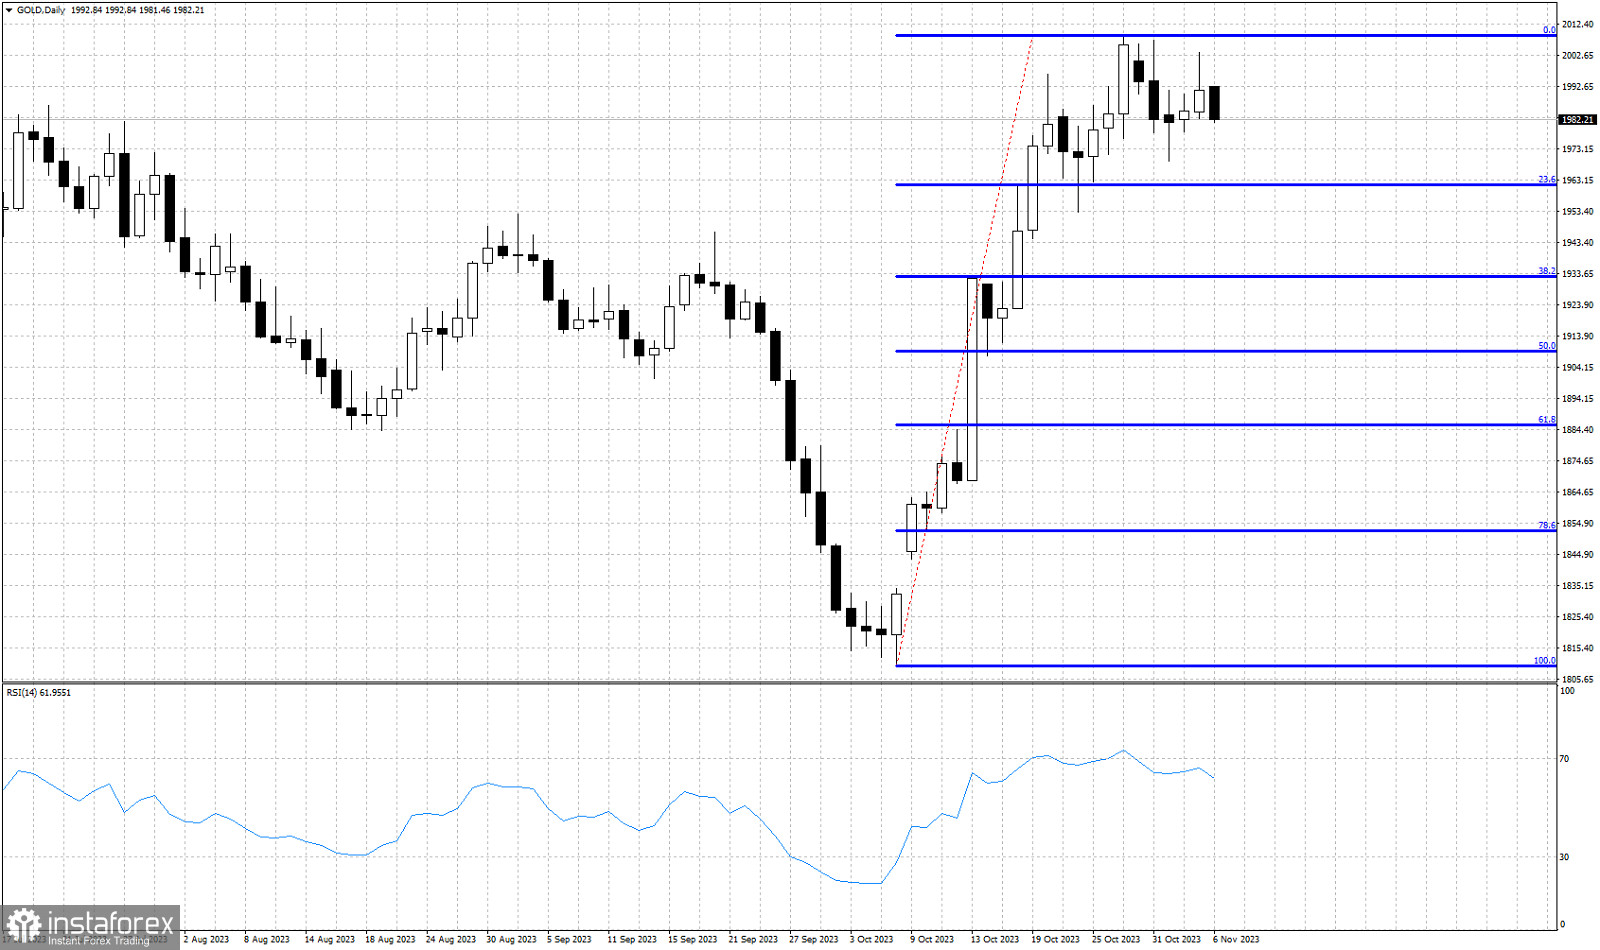
Blue lines- Fibonacci retracement levels

Gold price is trading around $1,982. Price has started the week on a negative note. Over the last few trading sessions price is showing a slowing down of the bullish momentum and signs of a possible short-term top and reversal. So far no reversal has been confirmed. With the RSI turning lower from overbought levels, Gold price justifies a pull back at least towards the 38% Fibonacci retracement level. Gold price remains vulnerable to a pull back towards $1,930. Nevertheless there is no confirmation of a reversal. Bulls remain in control of the trend.

Recommended Stories

Prediksi untuk EUR/USD pada 8 September 2025

Pada hari Jumat, pasangan EUR/USD melanjutkan pergerakan naiknya setelah memantul dari zona support 1,1637–1,1645. Pasangan ini terkonsolidasi di atas level retracement 76,4% di 1,1695, setelah itu pasangan ini mengalami penurunan

Samir Klishi 11:11 2025-09-08 UTC+2

Prediksi untuk GBP/USD pada 8 September 2025

Pada grafik per jam, pasangan GBP/USD pada hari Jumat melanjutkan pergerakan naiknya setelah memantul dari zona support 1,3416–1,3425 dan berkonsolidasi di atas level retracement 76,4% di 1,3482. Rebound dari level

Samir Klishi 11:01 2025-09-08 UTC+2

GBP/USD. Analisis teknikal untuk minggu 8–13 September

Minggu lalu, pasangan ini bergerak turun, menguji garis support di 1,3332 (garis tebal biru), dan kemudian bergerak naik, menutup candle mingguan di 1,3506. Pada minggu mendatang, harga mungkin akan terus

Stefan Doll 10:36 2025-09-08 UTC+2

EUR/USD. Analisis teknikal untuk minggu 8–13 September

Minggu lalu, pasangan ini bergerak turun, menguji EMA 13-hari di 1,1612 (garis tipis kuning), dan kemudian bergerak naik, menutup candle mingguan di 1,1718. Pada minggu mendatang, harga mungkin akan mulai

Stefan Doll 10:16 2025-09-08 UTC+2

GBP/USD. Analisis indikator pada 8 September 2025

Pada hari Jumat, pasangan ini bergerak naik, menguji level resistance historis di 1,3543 (garis putus-putus biru), kemudian bergerak turun, menutup candle harian di 1,3506. Hari ini, harga mungkin mencoba memulai

Stefan Doll 10:09 2025-09-08 UTC+2

EUR/USD. Analisis indikator pada 8 September 2025

Pada hari Jumat, pasangan ini bergerak naik, menguji fraktal atas di 1.1742 (garis putus-putus biru), dan kemudian bergerak turun, menutup candle harian di 1.1718. Hari ini, harga mungkin mencoba memulai

Stefan Doll 10:01 2025-09-08 UTC+2

Sinyal Trading untuk EUR/USD pada 8 September beli di atas 1.1720 (200 EMA - 8/8 Murray)

Jika euro terkonsolidasi di bawah level 8/8 Murray, ini akan dianggap sebagai peluang untuk menjual dalam beberapa jam ke depan, dengan target di bagian bawah saluran tren naik sekitar 1.1650

Dimitrios Zappas 07:50 2025-09-08 UTC+2

Sinyal Trading untuk EMAS (XAU/USD) pada 8 - 12 September 2025: jual di bawah $3.600 (8/8 Murray - 21 SMA)

Emas, setelah mencapai rekor tertingginya du sekitar $3.600, kini diperdagangkan di bawah level ini dan di bawah 8/8 Murray di sekitar $3.583. Data NFP AS yang lemah mendorong harga emas

Dimitrios Zappas 07:47 2025-09-08 UTC+2

Emas hari ini berpotensi melanjutkan penguatannya menuju ke Resistance terdekatnya, Senin 08 Spetmber 2025.

[XAU/USD] – [Senin, 08 September 2025] Dengan munculnya Divergent di RSI yang juga berada di level Netral Bearish memberi petunjuk akan adanya koreksi pelemahan, namun selama level 3550.46 sanggup menahan

Arief Makmur 06:21 2025-09-08 UTC+2

Meski ada potensi terkoreksi namun selama tidak tembus dan menutup dibawah 1,3436 Cable masih berada dalam bias yang menguat. Senin 08 September 2025.

[GBP/USD] – [Senin, 08 September 2025] Meski RSI berada di level Netral Bearish yang menandakan adanya pelemahan momentum namun selama level 1,3436 sanggup menahannya maka GBP/USD berpotensi untuk melanjutkan penguatannya

Arief Makmur 06:19 2025-09-08 UTC+2
Tidak bisa bicara sekarang?
Tanyakan pertanyaan anda lewat chat.
 

Dear visitor,

Your IP address shows that you are currently located in the USA. If you are a resident of the United States, you are prohibited from using the services of InstaFintech Group including online trading, online transfers, deposit/withdrawal of funds, etc.

If you think you are seeing this message by mistake and your location is not the US, kindly proceed to the website. Otherwise, you must leave the website in order to comply with government restrictions.

Why does your IP address show your location as the USA?

  • - you are using a VPN provided by a hosting company based in the United States;
  • - your IP does not have proper WHOIS records;
  • - an error occurred in the WHOIS geolocation database.

Please confirm whether you are a US resident or not by clicking the relevant button below. If you choose the wrong option, being a US resident, you will not be able to open an account with InstaTrade anyway.

We are sorry for any inconvenience caused by this message.