Lihat juga


 31.10.2022 11:20 AM
BITCOIN
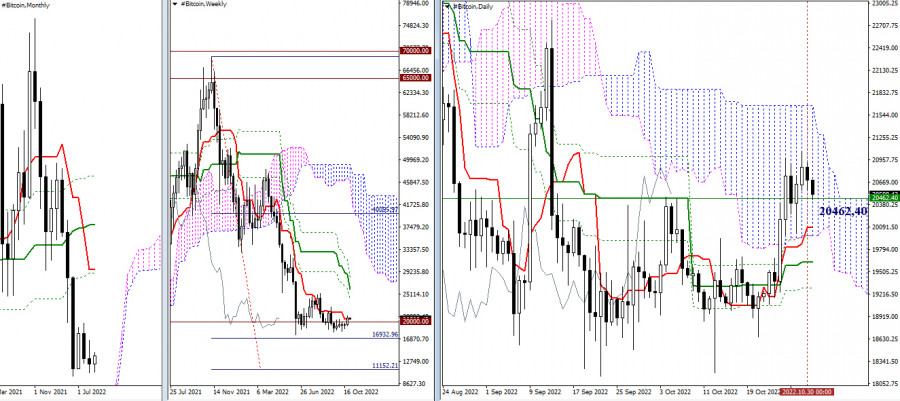
Following a bull run to 65,000, BTC failed to reach 70,000 and went deep down. Amid the increased bearish activity, a reversal took place. Ichimoku crosses saw changes in the weekly and monthly time frames. In addition, the weekly Cloud was broken and a bearish target formed. The targets at 16933 and 11152 are now seen as important barriers for the downtrend to extend. However, bitcoin is currently consolidating around the psychological support level of 20,000. Should the bears push the price further down, the bulls consolidate above the weekly short-term trend (20,462.40) and BTC leave the daily Cloud and enter a bullish zone, the target would stand at 24,043.77. The price would hit the target in case of a breakout through the daily Ichimoku Cloud and the resistance of the weekly Cross.
H4-H1
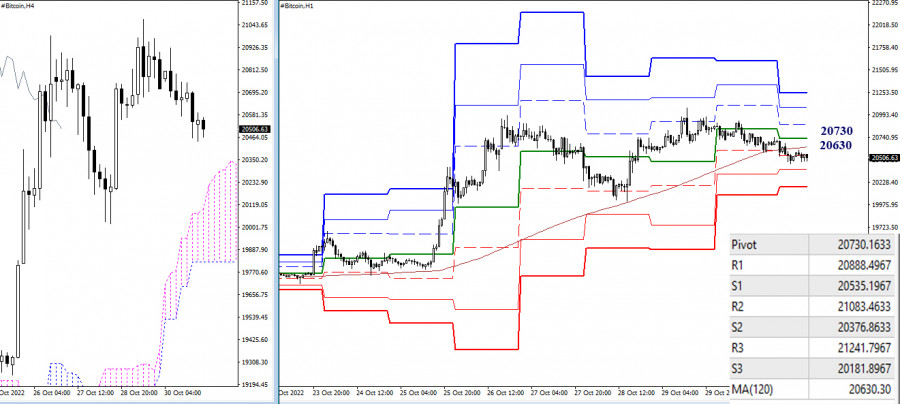
In the lower time frames, the downtrend is getting deeper. The bears are now active below the key levels of 20,630 – 20,730 (weekly long-term trend + central Pivot level). The downtrend would extend should bearish sentiment increase. The nearest intraday support levels are seen at 20,376.86 and 20,181.90 (classic Pivot levels). If BTC returns to the key levels of the lower time frames (20,630 – 20,730), the targets will stand at 20,888.50 – 21,083.46 – 21,241.80, in line with classic Pivot resistance.
***
Indicators used in technical analysis:
Higher time frames – Ichimoku Kinko Hyo (9.26.52) + Fibo Kijun
H1 – Pivot Points (classic) + Moving Average (120) (weekly long-term trend)
You have already liked this post today
*Analisis pasar yang diposting disini dimaksudkan untuk meningkatkan pengetahuan Anda namun tidak untuk memberi instruksi trading.
Di chart hariannya meski pergerakan harga EUR/USD masih berada diatas EMA (21) namun dengan kemunculan Divergence antara pergerakan harga Fiber dengan indikator Stochastic Oscillator telah memberi petunjuk kalau dalam waktu
Dari apa yang terlihat di chart hariannya instrumen komoditi Platinum terlihat masih bergerak dalam kondisi yang Sideways dimana hal ini terlihat dari EMA (34) yang bergerak melalui badan-badan Candlestick ditambah
Minggu lalu, pasar memperbarui posisi terendah, tetapi bear gagal melanjutkan pergerakan turun sepenuhnya. Hal ini mungkin disebabkan oleh posisi terendah minggu sebelumnya (141,63) yang diperkuat oleh level support bulanan (141,96)
Pada awal sesi Amerika, emas trading sekitar 3,276 dengan tekanan bearish setelah menemukan resistensi kuat di sekitar 3,270, level yang bertepatan dengan retracement Fibonacci 38,2%. Emas sekarang mungkin mencapai level
Pada sesi Amerika awal, pasangan EUR/USD diperdagangkan di sekitar 1,1358 dalam saluran tren turun yang terbentuk pada 18 April. Pasangan ini berada di bawah tekanan bearish. Kami percaya instrumen
Harga emas belakangan ini mengalami koreksi yang signifikan di tengah ekspektasi pasar akan dimulainya negosiasi nyata antara AS dan Tiongkok mengenai tarif dan perdagangan secara keseluruhan. Pernyataan Menteri Keuangan
Meski di chart 4 jamnya indeks Nasdaq 100 tengah Sideways, namun kisarannya cukup besar sehingga masih ada peluang yang cukup menjanjikan di indeks tersebut. Saat ini indikator Stochastic Oscillator tengah
Pada chart 4 jamnya, instrument komoditi Perak nampak terlihat meski kondisinya tengah menguat di mana hal ini terkonfirmasi oleh pergerakan harga Perak yang bergerak diatas WMA (30 Shift 2) yang
Rencana trading kami untuk beberapa jam ke depan adalah menjual emas di bawah $3.333, dengan target di $3.313 dan $3.291. Kami dapat membeli di atas $3.280 dengan target jangka pendek
Notifikasi
E-mail/SMS

Your IP address shows that you are currently located in the USA. If you are a resident of the United States, you are prohibited from using the services of InstaFintech Group including online trading, online transfers, deposit/withdrawal of funds, etc.
If you think you are seeing this message by mistake and your location is not the US, kindly proceed to the website. Otherwise, you must leave the website in order to comply with government restrictions.
Why does your IP address show your location as the USA?
Please confirm whether you are a US resident or not by clicking the relevant button below. If you choose the wrong option, being a US resident, you will not be able to open an account with InstaTrade anyway.
We are sorry for any inconvenience caused by this message.


