Lihat juga


 25.10.2021 01:00 PM
EUR/USD
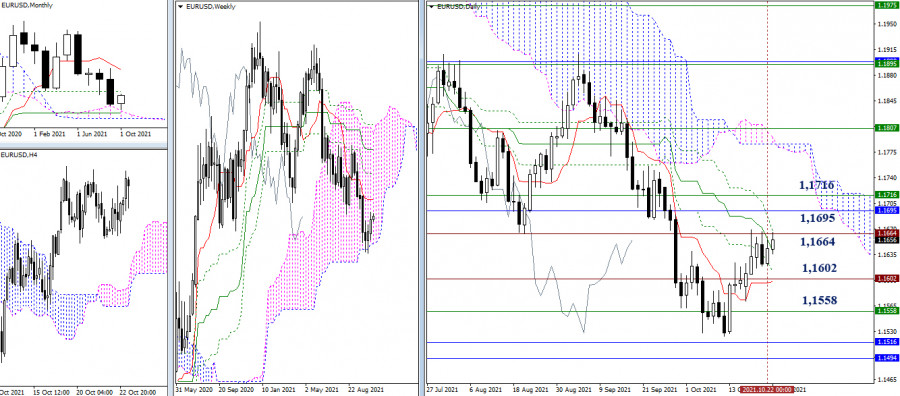
The slowdown below the historical resistance of 1.1664 remains. The final level of the Ichimoku daily dead cross (1.1667) has fallen into this area today. As a result, the breakdown of resistance will eliminate the bearish cross and help the bulls to strengthen their positions. The next upward targets are still at 1.1695 (monthly Fibo Kijun) and 1.1716 (weekly Tenkan). But in the case of bearish activity, the nearest support level of 1.1602 (historical level + daily levels) will be considered. The next interests can be directed to interacting with the level of 1.1558 (lower border of the weekly cloud) and 1.1516 - 1.1494 (monthly levels).
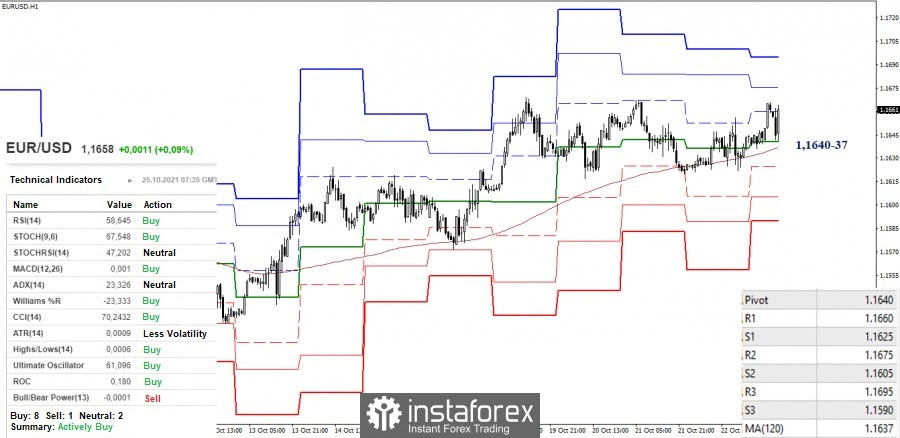
The pair continues to remain in the zone of the downward correction in the smaller timeframes. For a long time, the key support levels are being tested. They are joining forces in the area of 1.1640-37 today. A breakdown, consolidation below, and a reversal of moving averages will change the current balance of power in favor of the bears. The support for the classic pivot levels 1.1625 - 1.1605 - 1.1590 will serve as the intraday downward pivot points.
As for the bulls, the main task is to restore the upward trend (1.1669). The next upward pivot points can be 1.1675 (R2) and 1.1695 (R3), these resistances are being strengthened from the higher timeframes.
GBP/USD
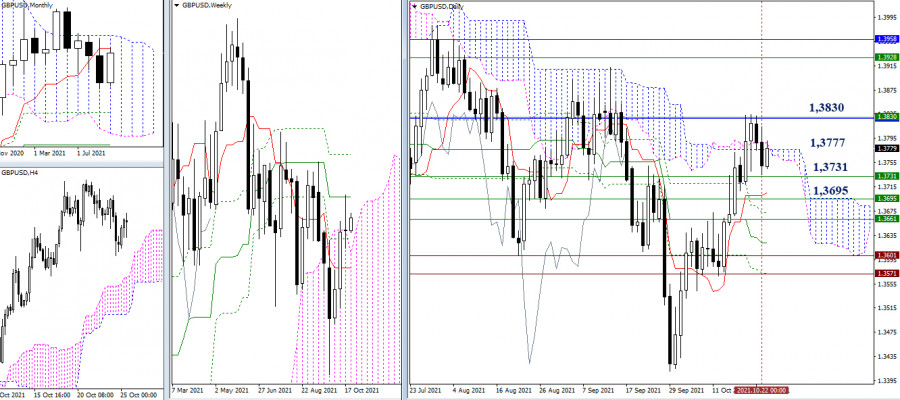
The bulls could not hold their positions below the encountered resistance level of 1.3830 (monthly short-term trend + weekly medium-term trend) during last week's closing. Currently, the attraction zone continues to provide a daily cloud (1.3777). The nearest support levels are set sequentially with some distance from each other – 1.3731 - 1.3695 - 1.3661 (daily and weekly levels).
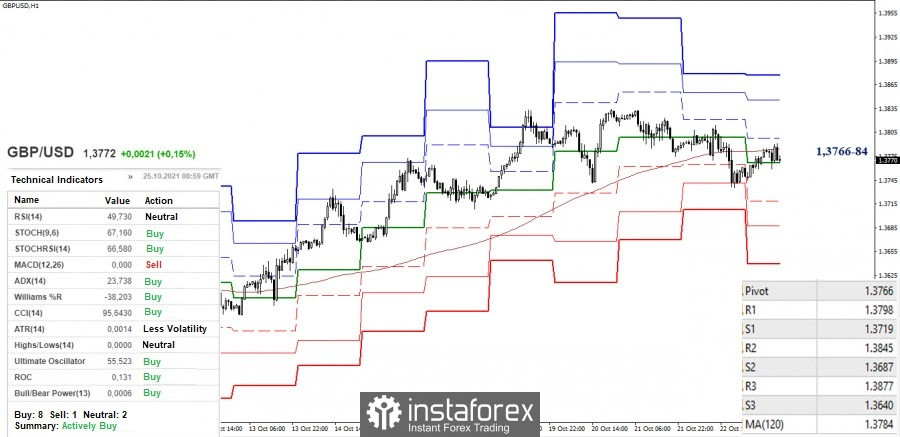
There is a struggle to reach the key levels in the smaller timeframes, which are uniting in the area of 1.3766-84 (central pivot level + weekly long-term trend). The continuation of the decline after the update of the low (1.3735) will open the way to the supports of the classic pivot levels (1.3719 - 1.3687 - 1.3640). On the contrary, a consolidation above the range of 1.3766-84 will set the task to recover the upward trend (1.3834). The resistances of the classic pivot levels 1.3845 and 1.3877 can be the additional upward pivot points within the day.
***
Ichimoku Kinko Hyo (9.26.52) and Kijun-sen levels in the higher time frames, as well as classic Pivot Points and Moving Average (120) on the H1 chart, are used in the technical analysis of the trading instruments.
You have already liked this post today
*Analisis pasar yang diposting disini dimaksudkan untuk meningkatkan pengetahuan Anda namun tidak untuk memberi instruksi trading.
Di chart hariannya meski pergerakan harga EUR/USD masih berada diatas EMA (21) namun dengan kemunculan Divergence antara pergerakan harga Fiber dengan indikator Stochastic Oscillator telah memberi petunjuk kalau dalam waktu
Dari apa yang terlihat di chart hariannya instrumen komoditi Platinum terlihat masih bergerak dalam kondisi yang Sideways dimana hal ini terlihat dari EMA (34) yang bergerak melalui badan-badan Candlestick ditambah
Minggu lalu, pasar memperbarui posisi terendah, tetapi bear gagal melanjutkan pergerakan turun sepenuhnya. Hal ini mungkin disebabkan oleh posisi terendah minggu sebelumnya (141,63) yang diperkuat oleh level support bulanan (141,96)
Pada awal sesi Amerika, emas trading sekitar 3,276 dengan tekanan bearish setelah menemukan resistensi kuat di sekitar 3,270, level yang bertepatan dengan retracement Fibonacci 38,2%. Emas sekarang mungkin mencapai level
Pada sesi Amerika awal, pasangan EUR/USD diperdagangkan di sekitar 1,1358 dalam saluran tren turun yang terbentuk pada 18 April. Pasangan ini berada di bawah tekanan bearish. Kami percaya instrumen
Harga emas belakangan ini mengalami koreksi yang signifikan di tengah ekspektasi pasar akan dimulainya negosiasi nyata antara AS dan Tiongkok mengenai tarif dan perdagangan secara keseluruhan. Pernyataan Menteri Keuangan
Meski di chart 4 jamnya indeks Nasdaq 100 tengah Sideways, namun kisarannya cukup besar sehingga masih ada peluang yang cukup menjanjikan di indeks tersebut. Saat ini indikator Stochastic Oscillator tengah
Pada chart 4 jamnya, instrument komoditi Perak nampak terlihat meski kondisinya tengah menguat di mana hal ini terkonfirmasi oleh pergerakan harga Perak yang bergerak diatas WMA (30 Shift 2) yang
Rencana trading kami untuk beberapa jam ke depan adalah menjual emas di bawah $3.333, dengan target di $3.313 dan $3.291. Kami dapat membeli di atas $3.280 dengan target jangka pendek
Indikator pola
grafis.
Lihat hal-hal
yang belum pernah anda lihat!
InstaTrade dalam angka

Your IP address shows that you are currently located in the USA. If you are a resident of the United States, you are prohibited from using the services of InstaFintech Group including online trading, online transfers, deposit/withdrawal of funds, etc.
If you think you are seeing this message by mistake and your location is not the US, kindly proceed to the website. Otherwise, you must leave the website in order to comply with government restrictions.
Why does your IP address show your location as the USA?
Please confirm whether you are a US resident or not by clicking the relevant button below. If you choose the wrong option, being a US resident, you will not be able to open an account with InstaTrade anyway.
We are sorry for any inconvenience caused by this message.


