

Actual patterns

Patterns are graphical models which are formed in the chart by the price. According to one of the technical analysis postulates, history (price movement) repeats itself. It means that the price movements are often similar in the same situations which makes it possible to predict the further development of the situation with a high probability.
Relevant patterns by InstaTrade is an easy-to-use service which allows you to be aware of latest changes in the market and react to clues from the market in time. In our service you will always find the latest and most relevant patterns on any pair and any timeframe.
Bullish Flag
was formed on 09.04 at 19:58:04 (UTC+0)
signal strength 1 of 5
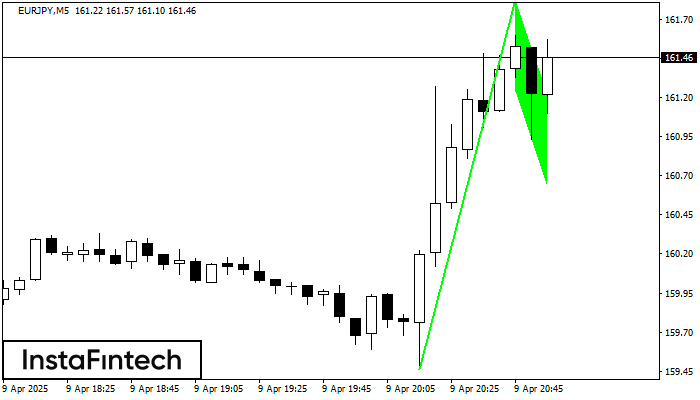
The Bullish Flag pattern has been formed on EURJPY at M5. The lower boundary of the pattern is located at 161.24/160.64, while the higher boundary lies at 161.82/161.22. The projection of the flagpole is 236 points. This formation signals that the upward trend is most likely to continue. Therefore, if the level of 161.82 is broken, the price will move further upwards.
The M5 and M15 time frames may have more false entry points.
- All
- All
- Bearish Rectangle
- Bearish Symmetrical Triangle
- Bearish Symmetrical Triangle
- Bullish Rectangle
- Double Top
- Double Top
- Triple Bottom
- Triple Bottom
- Triple Top
- Triple Top
- All
- All
- Buy
- Sale
- All
- 1
- 2
- 3
- 4
- 5
Double Top
was formed on 03.06 at 01:35:08 (UTC+0)
signal strength 1 of 5
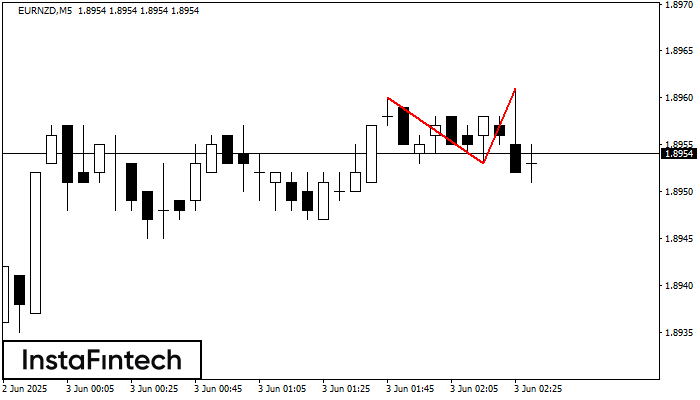
Pada carta EURNZD M5 corak pembalikan Double Top telah terbentuk. Ciri-ciri: sempadan atas 1.8961; sempadan bawah 1.8953; lebar corak 8 mata. Isyarat: penembusan sempadan bawah akan menyebabkan kesinambungan arah aliran
Carta masa M5 dan M15 mungkin mempunyai lebih banyak titik kemasukan palsu.
Open chart in a new window
Triple Top
was formed on 03.06 at 00:30:20 (UTC+0)
signal strength 3 of 5
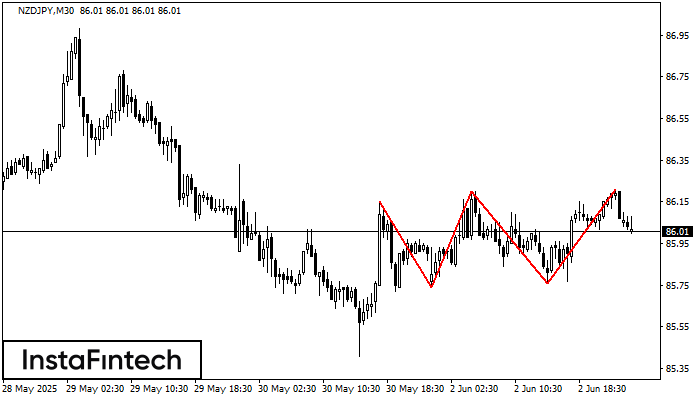
Corak Triple Top telah dibentuk pada carta NZDJPY M30. Ciri corak: sempadan mempunyai sudut menaik; garisan bawah corak mempunyai koordinat 85.74/85.76 dengan had atas 86.15/86.21; unjuran lebar ialah 41 mata
Open chart in a new window
Triple Bottom
was formed on 03.06 at 00:05:20 (UTC+0)
signal strength 1 of 5

Corak Triple Bottom telah dibentuk pada carta USDJPY M5. Ciri-ciri corak: Garisan bawah corak mempunyai koordinat 142.75 dengan had atas 142.75/142.69, unjuran lebar adalah 7 mata. Pembentukan corak Triple Bottom
Carta masa M5 dan M15 mungkin mempunyai lebih banyak titik kemasukan palsu.
Open chart in a new window


