

Actual patterns

Patterns are graphical models which are formed in the chart by the price. According to one of the technical analysis postulates, history (price movement) repeats itself. It means that the price movements are often similar in the same situations which makes it possible to predict the further development of the situation with a high probability.
Relevant patterns by InstaTrade is an easy-to-use service which allows you to be aware of latest changes in the market and react to clues from the market in time. In our service you will always find the latest and most relevant patterns on any pair and any timeframe.
Bullish Rectangle
was formed on 09.04 at 02:09:41 (UTC+0)
signal strength 3 of 5
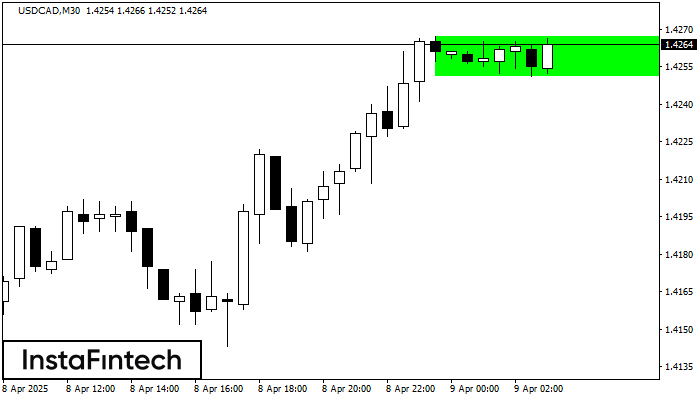
According to the chart of M30, USDCAD formed the Bullish Rectangle. The pattern indicates a trend continuation. The upper border is 1.4267, the lower border is 1.4251. The signal means that a long position should be opened above the upper border 1.4267 of the Bullish Rectangle.
- All
- All
- Bearish Rectangle
- Bearish Symmetrical Triangle
- Bearish Symmetrical Triangle
- Bullish Rectangle
- Double Top
- Double Top
- Triple Bottom
- Triple Bottom
- Triple Top
- Triple Top
- All
- All
- Buy
- Sale
- All
- 1
- 2
- 3
- 4
- 5
Тройная вершина
сформирован 30.05 в 22:20:23 (UTC+0)
сила сигнала 1 из 5

По GOLD на M5 сформировалась фигура «Тройная вершина». Характеристика: Границы имеют восходящий угол. Нижняя граница фигуры имеет координаты 3289.23/3291.16, при этом верхняя граница 3295.36/3295.32. Проекция ширины 613 пунктов. Формирование фигуры
Таймфреймы М5 и М15 могут иметь больше ложных точек входа.
Открыть график инструмента в новом окне
Перевернутая голова и плечи
сформирован 30.05 в 21:50:24 (UTC+0)
сила сигнала 1 из 5

По #AMZN на M5 сформировалась фигура «Перевернутая голова и плечи». Голова закреплена на 201.64, при этом средняя линия шеи расположена на 204.52/205.01. Формирование фигуры «Перевернутая голова и плечи» наиболее вероятным
Таймфреймы М5 и М15 могут иметь больше ложных точек входа.
Открыть график инструмента в новом окне
Прямоугольник
сформирован 30.05 в 21:36:36 (UTC+0)
сила сигнала 1 из 5

По торговому инструменту GBPAUD на M5 сформировалась фигура продолжения тренда - «Прямоугольник». Фигура имеет границы: Нижняя 2.0897; Верхняя 2.0908. В случае пробоя нижней границы вероятно дальнейшее движение в сторону тренда
Таймфреймы М5 и М15 могут иметь больше ложных точек входа.
Открыть график инструмента в новом окне


