

Actual patterns

Patterns are graphical models which are formed in the chart by the price. According to one of the technical analysis postulates, history (price movement) repeats itself. It means that the price movements are often similar in the same situations which makes it possible to predict the further development of the situation with a high probability.
Relevant patterns by InstaTrade is an easy-to-use service which allows you to be aware of latest changes in the market and react to clues from the market in time. In our service you will always find the latest and most relevant patterns on any pair and any timeframe.
Triple Top
was formed on 02.04 at 06:50:26 (UTC+0)
signal strength 1 of 5
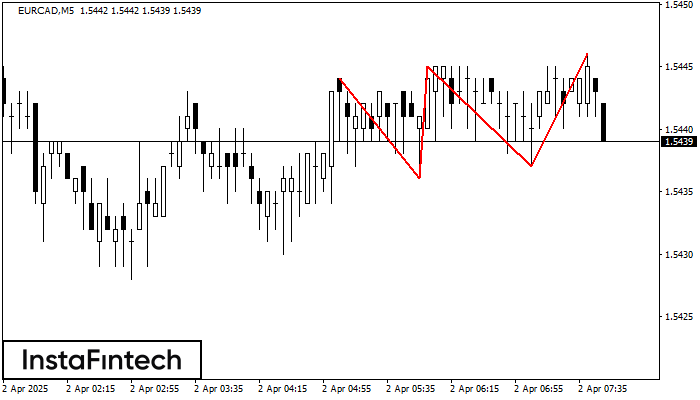
The Triple Top pattern has formed on the chart of the EURCAD M5. Features of the pattern: borders have an ascending angle; the lower line of the pattern has the coordinates 1.5436/1.5437 with the upper limit 1.5444/1.5446; the projection of the width is 8 points. The formation of the Triple Top figure most likely indicates a change in the trend from upward to downward. This means that in the event of a breakdown of the support level of 1.5436, the price is most likely to continue the downward movement.
The M5 and M15 time frames may have more false entry points.
- All
- All
- Bearish Rectangle
- Bearish Symmetrical Triangle
- Bearish Symmetrical Triangle
- Bullish Rectangle
- Double Top
- Double Top
- Triple Bottom
- Triple Bottom
- Triple Top
- Triple Top
- All
- All
- Buy
- Sale
- All
- 1
- 2
- 3
- 4
- 5
Đỉnh đôi
was formed on 24.04 at 09:00:36 (UTC+0)
signal strength 3 of 5
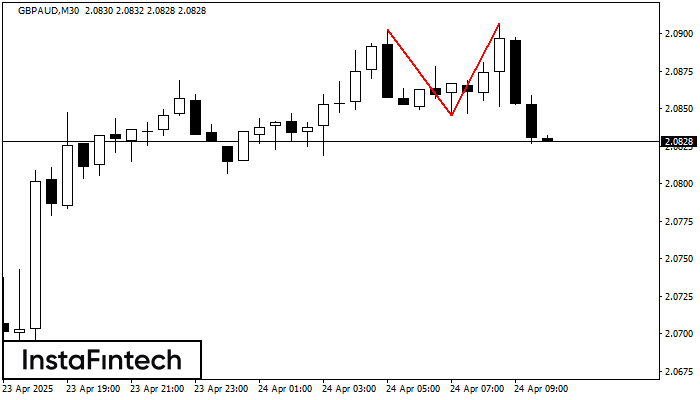
Mô hình Đỉnh đôi đã được hình thành trên GBPAUD M30. Nó báo hiệu rằng xu hướng đã được thay đổi từ hướng lên thành hướng xuống
Open chart in a new window
Đáy ba
was formed on 24.04 at 08:30:33 (UTC+0)
signal strength 3 of 5
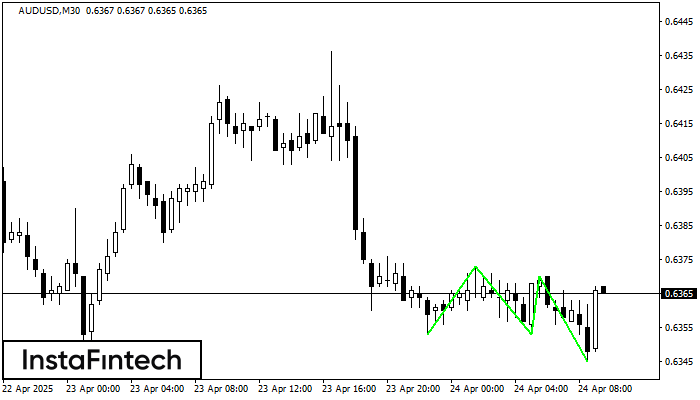
Mô hình Đáy ba đã được hình thành trên biểu đồ của AUDUSD M30. Các tính năng của mô hình: Đường dưới của mô hình có tọa độ 0.6373
Open chart in a new window
Đáy đôi
was formed on 24.04 at 08:30:24 (UTC+0)
signal strength 3 of 5
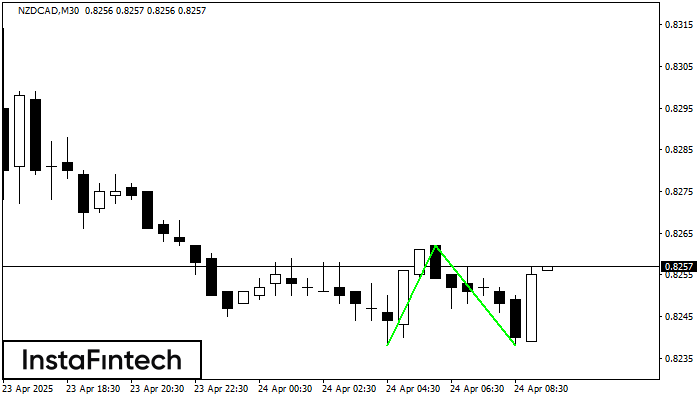
Mô hình Đáy đôi đã được hình thành trên NZDCAD M30. Sự hình thành này báo hiệu sự đảo chiều của xu hướng từ dưới lên trên. Tín hiệu
Open chart in a new window


