

Actual patterns

Patterns are graphical models which are formed in the chart by the price. According to one of the technical analysis postulates, history (price movement) repeats itself. It means that the price movements are often similar in the same situations which makes it possible to predict the further development of the situation with a high probability.
Relevant patterns by InstaTrade is an easy-to-use service which allows you to be aware of latest changes in the market and react to clues from the market in time. In our service you will always find the latest and most relevant patterns on any pair and any timeframe.
Bearish Symmetrical Triangle
was formed on 21.03 at 10:30:41 (UTC+0)
signal strength 3 of 5
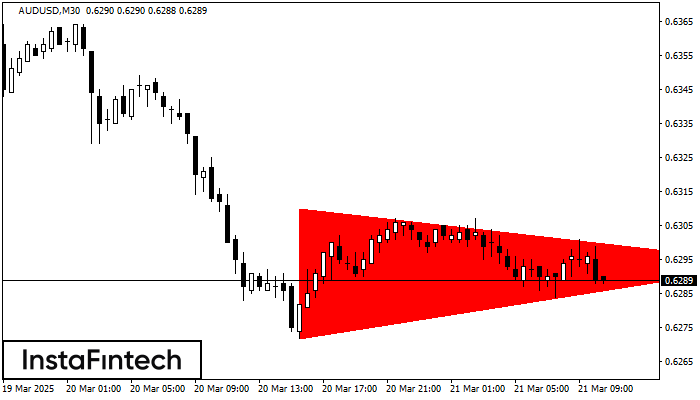
According to the chart of M30, AUDUSD formed the Bearish Symmetrical Triangle pattern. Description: The lower border is 0.6272/0.6294 and upper border is 0.6310/0.6294. The pattern width is measured on the chart at -38 pips. The formation of the Bearish Symmetrical Triangle pattern evidently signals a continuation of the downward trend. In other words, if the scenario comes true and AUDUSD breaches the lower border, the price could continue its move toward 0.6264.
- All
- All
- Bearish Rectangle
- Bearish Symmetrical Triangle
- Bearish Symmetrical Triangle
- Bullish Rectangle
- Double Top
- Double Top
- Triple Bottom
- Triple Bottom
- Triple Top
- Triple Top
- All
- All
- Buy
- Sale
- All
- 1
- 2
- 3
- 4
- 5
Double Bottom
was formed on 02.06 at 05:25:31 (UTC+0)
signal strength 1 of 5
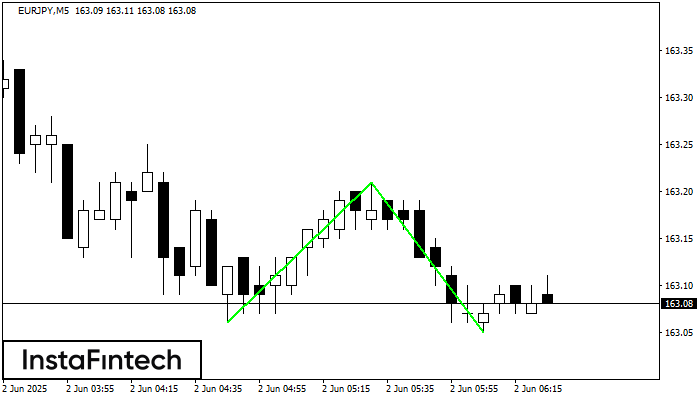
Corak Double Bottom telah dibentuk pada EURJPY M5; sempadan atas adalah 163.21; sempadan bawah adalah 163.05. Lebar corak adalah 15 mata. Sekiranya penembusan sempadan atas 163.21, perubahan aliran boleh diramalkan
Carta masa M5 dan M15 mungkin mempunyai lebih banyak titik kemasukan palsu.
Open chart in a new window
Segi Tiga Simetri Menaik
was formed on 02.06 at 05:21:10 (UTC+0)
signal strength 1 of 5
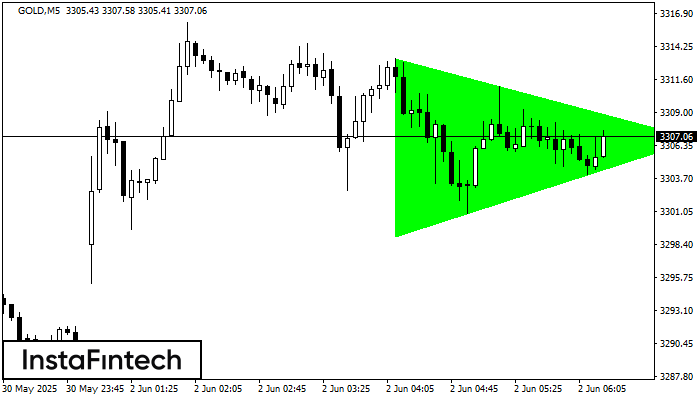
Berdasarkan carta M5, GOLD membentuk corak Segi Tiga Simetri Menaik yang menandakan aliran akan berterusan. Penerangan. Sempadan atas corak menyentuh koordinat 3313.29/3306.86 sedangkan sempadan bawah merentasi 3299.06/3306.86. Lebar corak diukur
Carta masa M5 dan M15 mungkin mempunyai lebih banyak titik kemasukan palsu.
Open chart in a new window
Double Bottom
was formed on 02.06 at 05:00:29 (UTC+0)
signal strength 4 of 5
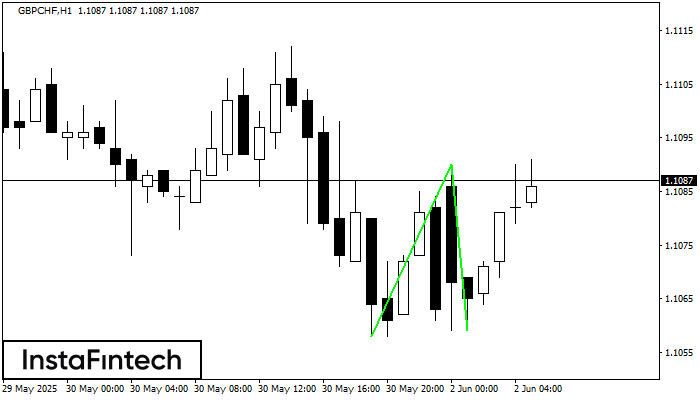
Corak Double Bottom telah dibentuk pada GBPCHF H1. Pembentukan ini menandakan pembalikan aliran dari aliran menurun ke atas. Isyarat ialah perdagangan membeli harus dibuka selepas sempadan atas corak 1.1090 telah
Open chart in a new window


