

Actual patterns

Patterns are graphical models which are formed in the chart by the price. According to one of the technical analysis postulates, history (price movement) repeats itself. It means that the price movements are often similar in the same situations which makes it possible to predict the further development of the situation with a high probability.
Relevant patterns by InstaTrade is an easy-to-use service which allows you to be aware of latest changes in the market and react to clues from the market in time. In our service you will always find the latest and most relevant patterns on any pair and any timeframe.
Bullish Symmetrical Triangle
was formed on 15.04 at 23:01:57 (UTC+0)
signal strength 4 of 5

According to the chart of H1, AUDJPY formed the Bullish Symmetrical Triangle pattern. Description: This is the pattern of a trend continuation. 91.35 and 90.50 are the coordinates of the upper and lower borders respectively. The pattern width is measured on the chart at 85 pips. Outlook: If the upper border 91.35 is broken, the price is likely to continue its move by 91.40.
See Also
- All
- All
- Bearish Rectangle
- Bearish Symmetrical Triangle
- Bearish Symmetrical Triangle
- Bullish Rectangle
- Double Top
- Double Top
- Triple Bottom
- Triple Bottom
- Triple Top
- Triple Top
- All
- All
- Buy
- Sale
- All
- 1
- 2
- 3
- 4
- 5
Double Top
was formed on 02.06 at 17:30:00 (UTC+0)
signal strength 1 of 5
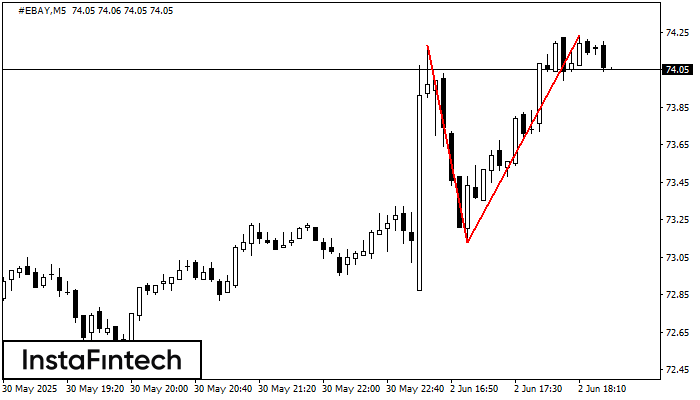
Pada carta #EBAY M5 corak pembalikan Double Top telah terbentuk. Ciri-ciri: sempadan atas 74.23; sempadan bawah 73.13; lebar corak 110 mata. Isyarat: penembusan sempadan bawah akan menyebabkan kesinambungan arah aliran
Carta masa M5 dan M15 mungkin mempunyai lebih banyak titik kemasukan palsu.
Open chart in a new window
Pennant Aliran Menurun
was formed on 02.06 at 17:29:49 (UTC+0)
signal strength 2 of 5
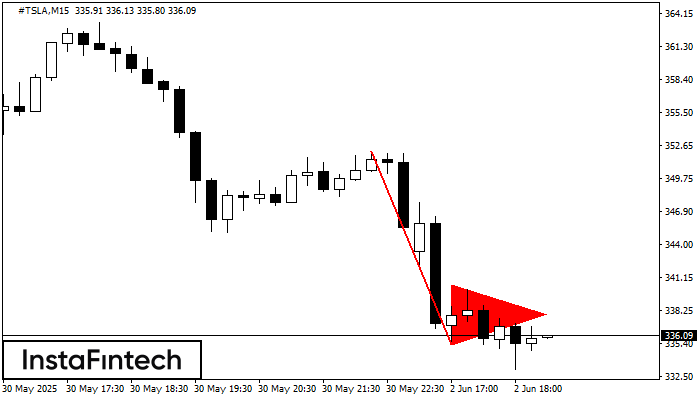
Corak Pennant Aliran Menurun telah dibentuk pada carta #TSLA M15. Jenis corak ini dicirikan oleh sedikit penurunan di mana selepas itu harga akan bergerak ke arah aliran asal. Sekiranya harga
Carta masa M5 dan M15 mungkin mempunyai lebih banyak titik kemasukan palsu.
Open chart in a new window
Triple Top
was formed on 02.06 at 17:29:48 (UTC+0)
signal strength 1 of 5
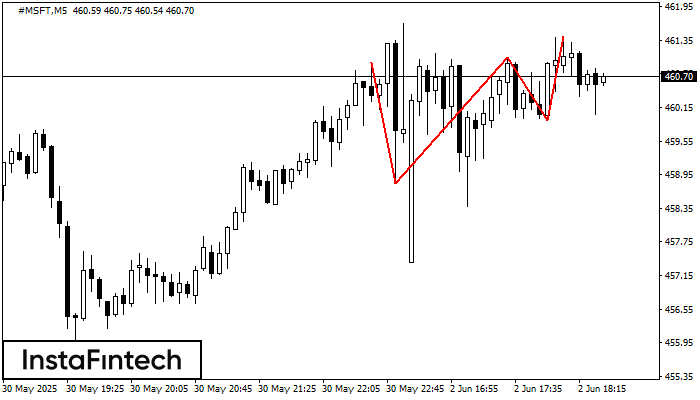
Pada carta instrumen dagangan #MSFT M5, corak Triple Top yang menandakan perubahan aliran telah terbentuk. Adalah mungkin bahawa selepas pembentukan bahagian atas ketiga, harga akan cuba menembusi tahap rintangan 458.79
Carta masa M5 dan M15 mungkin mempunyai lebih banyak titik kemasukan palsu.
Open chart in a new window


