

Actual patterns

Patterns are graphical models which are formed in the chart by the price. According to one of the technical analysis postulates, history (price movement) repeats itself. It means that the price movements are often similar in the same situations which makes it possible to predict the further development of the situation with a high probability.
Relevant patterns by InstaTrade is an easy-to-use service which allows you to be aware of latest changes in the market and react to clues from the market in time. In our service you will always find the latest and most relevant patterns on any pair and any timeframe.
Bearish Rectangle
was formed on 10.04 at 04:44:16 (UTC+0)
signal strength 1 of 5
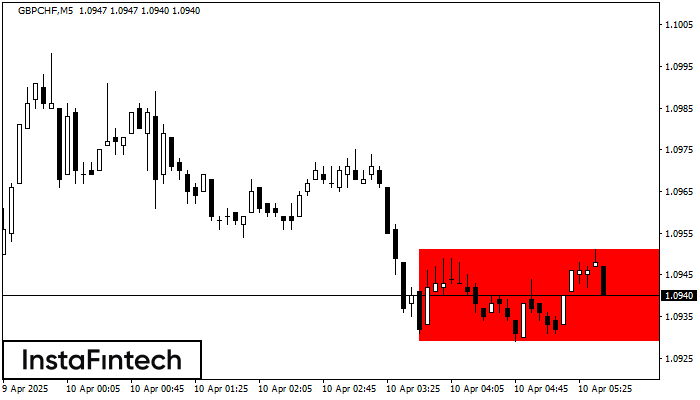
According to the chart of M5, GBPCHF formed the Bearish Rectangle. This type of a pattern indicates a trend continuation. It consists of two levels: resistance 1.0951 - 0.0000 and support 1.0929 – 1.0929. In case the resistance level 1.0929 - 1.0929 is broken, the instrument is likely to follow the bearish trend.
The M5 and M15 time frames may have more false entry points.
See Also
- All
- All
- Bearish Rectangle
- Bearish Symmetrical Triangle
- Bearish Symmetrical Triangle
- Bullish Rectangle
- Double Top
- Double Top
- Triple Bottom
- Triple Bottom
- Triple Top
- Triple Top
- All
- All
- Buy
- Sale
- All
- 1
- 2
- 3
- 4
- 5
Kepala dan Bahu Terbalik
was formed on 30.05 at 07:31:35 (UTC+0)
signal strength 3 of 5
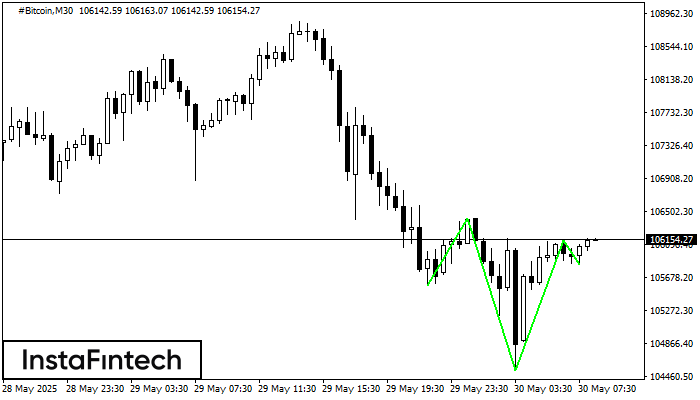
Menurut M30, #Bitcoin membentuk pola teknikal – Kepala dan Bahu Terbalik. Jika garis leher (Neckline) 106415.11/106138.63 ditembus, maka instrumen ini kemungkinan akan bergerak menuju 106138.90
Open chart in a new window
Bawah Ganda
was formed on 30.05 at 07:15:27 (UTC+0)
signal strength 2 of 5
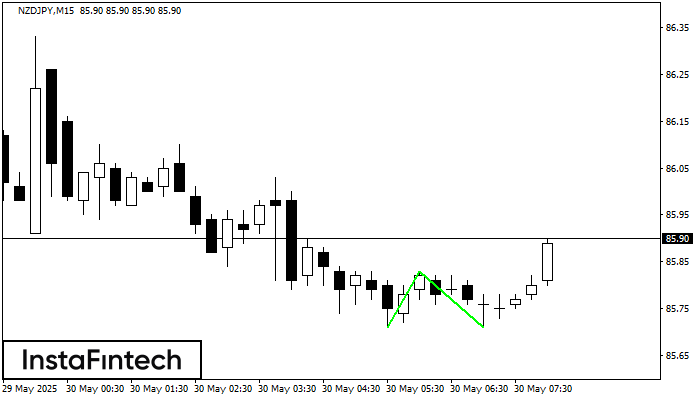
Pola Bawah Ganda telah terbentuk pada NZDJPY M15. Formasi ini mensinyalkan reversal tren dari arah penurunan ke arah kenaikan. Sinyal menunjukkan bahwa transaksi beli harus dibuka setelah batas atas pola
Rangka waktu M5 dan M15 mungkin memiliki lebih dari titik entri yang keliru.
Open chart in a new window
Kepala dan Bahu Terbalik
was formed on 30.05 at 07:15:09 (UTC+0)
signal strength 2 of 5
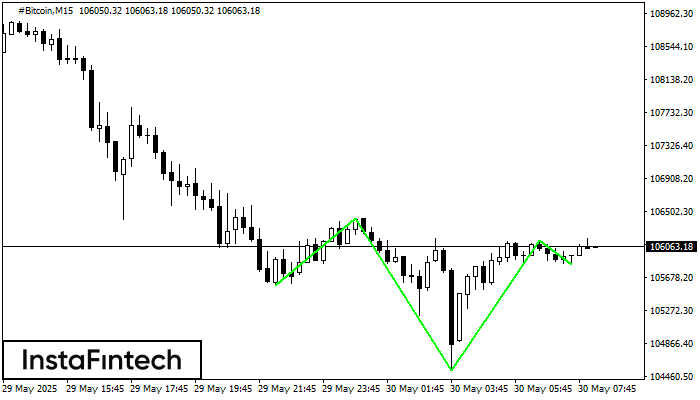
Menurut grafik M15, #Bitcoin menghasilkan pola yang disebut Kepala dan Bahu Terbalik. The Head ditetapkan di 104531.88 sementara garis median The Neck ditetapkan di 106415.11/106138.63. Formasi Pola Kepala dan Bahu
Rangka waktu M5 dan M15 mungkin memiliki lebih dari titik entri yang keliru.
Open chart in a new window


