

Actual patterns

Patterns are graphical models which are formed in the chart by the price. According to one of the technical analysis postulates, history (price movement) repeats itself. It means that the price movements are often similar in the same situations which makes it possible to predict the further development of the situation with a high probability.
Relevant patterns by InstaTrade is an easy-to-use service which allows you to be aware of latest changes in the market and react to clues from the market in time. In our service you will always find the latest and most relevant patterns on any pair and any timeframe.
Double Top
was formed on 07.04 at 05:40:20 (UTC+0)
signal strength 1 of 5
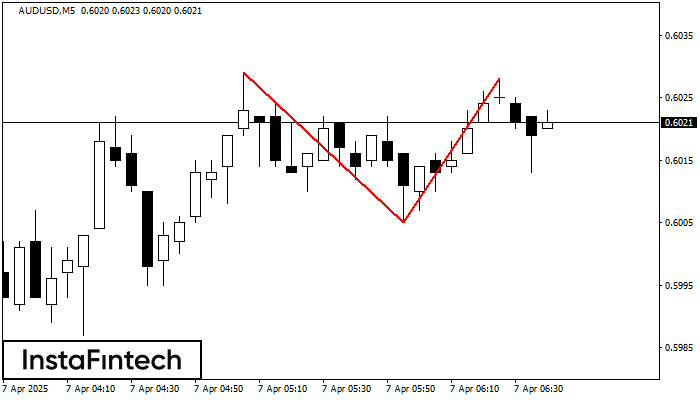
The Double Top pattern has been formed on AUDUSD M5. It signals that the trend has been changed from upwards to downwards. Probably, if the base of the pattern 0.6005 is broken, the downward movement will continue.
The M5 and M15 time frames may have more false entry points.
- All
- All
- Bearish Rectangle
- Bearish Symmetrical Triangle
- Bearish Symmetrical Triangle
- Bullish Rectangle
- Double Top
- Double Top
- Triple Bottom
- Triple Bottom
- Triple Top
- Triple Top
- All
- All
- Buy
- Sale
- All
- 1
- 2
- 3
- 4
- 5
Fundo duplo
was formed on 31.05 at 13:20:01 (UTC+0)
signal strength 1 of 5

O padrão Fundo duplo foi formado em #Bitcoin M5. Características: o nível de suporte 103250.25; o nível de resistência 103385.09; a largura do padrão 13484 pontos. Se o nível
Os intervalos M5 e M15 podem ter mais pontos de entrada falsos.
Open chart in a new window
Topo triplo
was formed on 30.05 at 22:20:23 (UTC+0)
signal strength 1 of 5

O padrão Topo triplo foi formado no gráfico do instrumento de negociação GOLD M5. É um padrão de reversão com as seguintes características: nível de resistência 4, nível de suporte
Os intervalos M5 e M15 podem ter mais pontos de entrada falsos.
Open chart in a new window
Cabeça & Ombro Invertidos
was formed on 30.05 at 21:50:24 (UTC+0)
signal strength 1 of 5

De acordo com o gráfico de M5, #AMZN produziu o padrão denominado Cabeça & Ombro Invertidos. A Cabeça é definida em 201.64 enquanto a linha mediana do Pescoço é definida
Os intervalos M5 e M15 podem ter mais pontos de entrada falsos.
Open chart in a new window

