

Actual patterns

Patterns are graphical models which are formed in the chart by the price. According to one of the technical analysis postulates, history (price movement) repeats itself. It means that the price movements are often similar in the same situations which makes it possible to predict the further development of the situation with a high probability.
Relevant patterns by InstaTrade is an easy-to-use service which allows you to be aware of latest changes in the market and react to clues from the market in time. In our service you will always find the latest and most relevant patterns on any pair and any timeframe.
Bearish Symmetrical Triangle
was formed on 03.04 at 03:37:30 (UTC+0)
signal strength 1 of 5
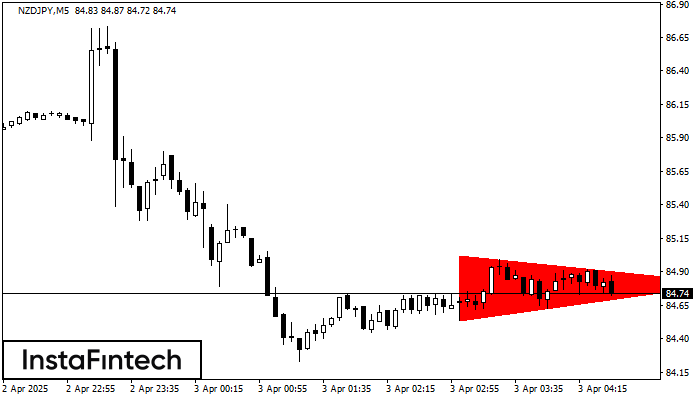
According to the chart of M5, NZDJPY formed the Bearish Symmetrical Triangle pattern. This pattern signals a further downward trend in case the lower border 84.54 is breached. Here, a hypothetical profit will equal the width of the available pattern that is -48 pips.
The M5 and M15 time frames may have more false entry points.
See Also
- All
- All
- Bearish Rectangle
- Bearish Symmetrical Triangle
- Bearish Symmetrical Triangle
- Bullish Rectangle
- Double Top
- Double Top
- Triple Bottom
- Triple Bottom
- Triple Top
- Triple Top
- All
- All
- Buy
- Sale
- All
- 1
- 2
- 3
- 4
- 5
Голова и плечи
сформирован 05.06 в 04:45:35 (UTC+0)
сила сигнала 1 из 5
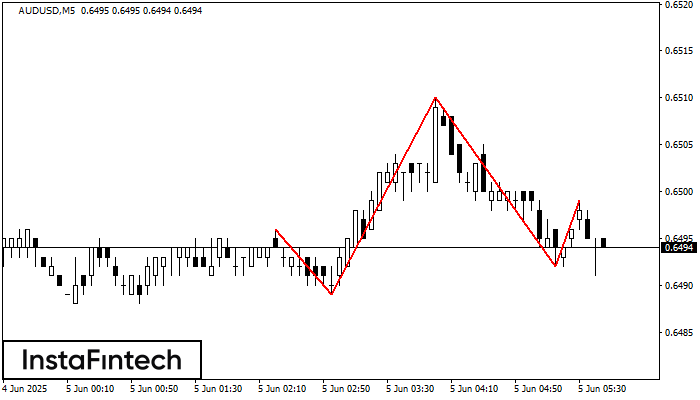
Графическая фигура «Голова и плечи» сформировалась по инструменту AUDUSD на M5. Вероятно предполагать, что после формирования правого плеча цена преодолеет уровень шеи 0.6489/0.6492, изменяя тем самым тенденцию и фактически направляя
Таймфреймы М5 и М15 могут иметь больше ложных точек входа.
Открыть график инструмента в новом окне
Прямоугольник
сформирован 05.06 в 04:06:17 (UTC+0)
сила сигнала 2 из 5

Сформирована фигура «Прямоугольник» на графике EURCHF M15. Тип фигуры: Продолжение тренда; Границы: Верхняя 0.9348, Нижняя 0.9337; Сигнал: позиция на продажу открывается после фиксации цены ниже границы прямоугольника 0.9337
Таймфреймы М5 и М15 могут иметь больше ложных точек входа.
Открыть график инструмента в новом окне
Двойная вершина
сформирован 05.06 в 04:00:46 (UTC+0)
сила сигнала 3 из 5
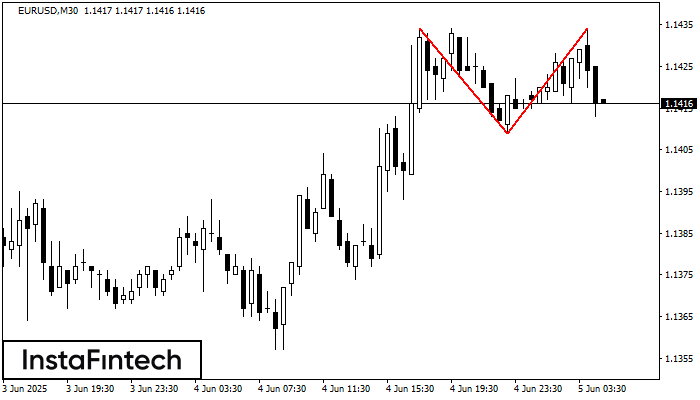
По торговому инструменту EURUSD на M30 сформировалась фигура «Двойная вершина», которая сигнализирует нам об изменении тенденции с восходящей на нисходящую. Вероятно, что, в случае пробоя основания фигуры 1.1409, возможно дальнейшее
Открыть график инструмента в новом окне


