

Actual patterns

Patterns are graphical models which are formed in the chart by the price. According to one of the technical analysis postulates, history (price movement) repeats itself. It means that the price movements are often similar in the same situations which makes it possible to predict the further development of the situation with a high probability.
Relevant patterns by InstaTrade is an easy-to-use service which allows you to be aware of latest changes in the market and react to clues from the market in time. In our service you will always find the latest and most relevant patterns on any pair and any timeframe.
Bullish Symmetrical Triangle
was formed on 01.04 at 21:46:13 (UTC+0)
signal strength 1 of 5
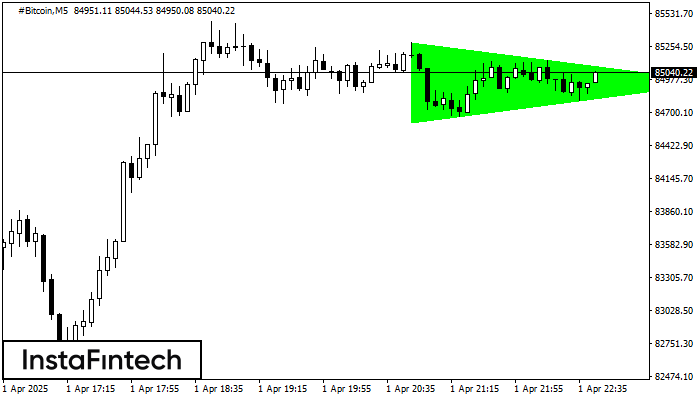
According to the chart of M5, #Bitcoin formed the Bullish Symmetrical Triangle pattern, which signals the trend will continue. Description. The upper border of the pattern touches the coordinates 85289.02/84955.46 whereas the lower border goes across 84612.93/84955.46. The pattern width is measured on the chart at 67609 pips. If the Bullish Symmetrical Triangle pattern is in progress during the upward trend, this indicates the current trend will go on. In case 84955.46 is broken, the price could continue its move toward 84955.61.
The M5 and M15 time frames may have more false entry points.
- All
- All
- Bearish Rectangle
- Bearish Symmetrical Triangle
- Bearish Symmetrical Triangle
- Bullish Rectangle
- Double Top
- Double Top
- Triple Bottom
- Triple Bottom
- Triple Top
- Triple Top
- All
- All
- Buy
- Sale
- All
- 1
- 2
- 3
- 4
- 5
Bawah Ganda
was formed on 30.05 at 12:31:28 (UTC+0)
signal strength 3 of 5
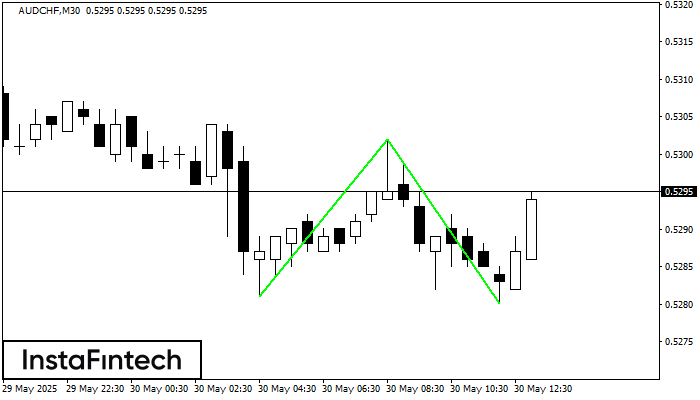
Pola Bawah Ganda telah terbentuk pada AUDCHF M30. Karakteristik: level support 0.5281; level resistance 0.5302; lebar pola 21 poin. Jika level resistance ditembus, perubahan dalam tren dapat diprediksi dengan target
Open chart in a new window
Bawah Ganda
was formed on 30.05 at 12:00:29 (UTC+0)
signal strength 2 of 5
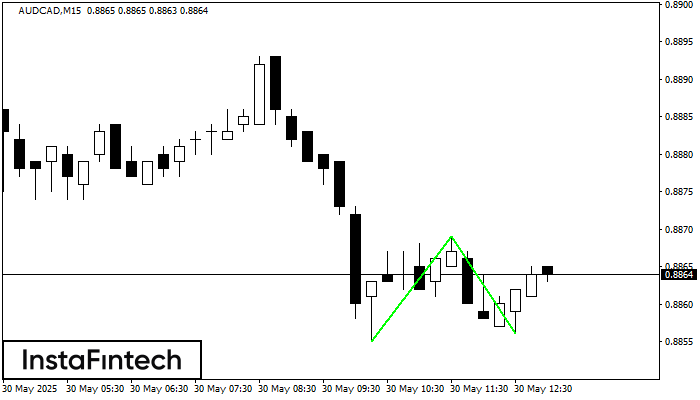
Pola Bawah Ganda telah terbentuk pada AUDCAD M15; batas atas di 0.8869; batas bawah di 0.8856. Lebar pola sebesar 14 poin. Jika harga menembus batas atas 0.8869, Perubahan dalam tren
Rangka waktu M5 dan M15 mungkin memiliki lebih dari titik entri yang keliru.
Open chart in a new window
Bawah Triple
was formed on 30.05 at 11:36:39 (UTC+0)
signal strength 1 of 5
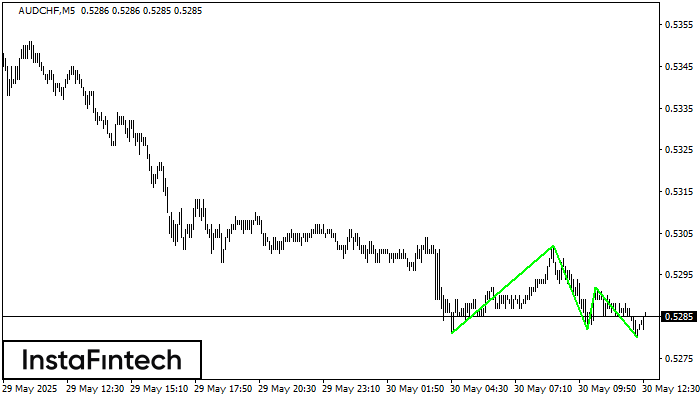
Pola Bawah Triple telah terbentuk pada grafik AUDCHF M5. Fitur-fitur pola: garis bawah pola memiliki koordinat 0.5302 dengan batas atas 0.5302/0.5292, proyeksi lebar adalah 21 poin. Pembentukan pola Bawah Triple
Rangka waktu M5 dan M15 mungkin memiliki lebih dari titik entri yang keliru.
Open chart in a new window


