Actual patterns

Patterns are graphical models which are formed in the chart by the price. According to one of the technical analysis postulates, history (price movement) repeats itself. It means that the price movements are often similar in the same situations which makes it possible to predict the further development of the situation with a high probability.
Relevant patterns by InstaTrade is an easy-to-use service which allows you to be aware of latest changes in the market and react to clues from the market in time. In our service you will always find the latest and most relevant patterns on any pair and any timeframe.
Double Top
was formed on 28.03 at 10:30:00 (UTC+0)
signal strength 3 of 5
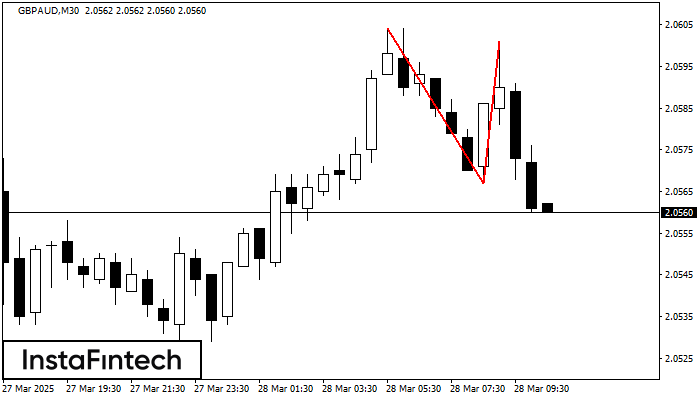
On the chart of GBPAUD M30 the Double Top reversal pattern has been formed. Characteristics: the upper boundary 2.0601; the lower boundary 2.0567; the width of the pattern 34 points. The signal: a break of the lower boundary will cause continuation of the downward trend targeting the 2.0537 level.
- All
- All
- Bearish Rectangle
- Bearish Symmetrical Triangle
- Bearish Symmetrical Triangle
- Bullish Rectangle
- Double Top
- Double Top
- Triple Bottom
- Triple Bottom
- Triple Top
- Triple Top
- All
- All
- Buy
- Sale
- All
- 1
- 2
- 3
- 4
- 5
Head dan Shoulders
was formed on 05.06 at 04:45:35 (UTC+0)
signal strength 1 of 5
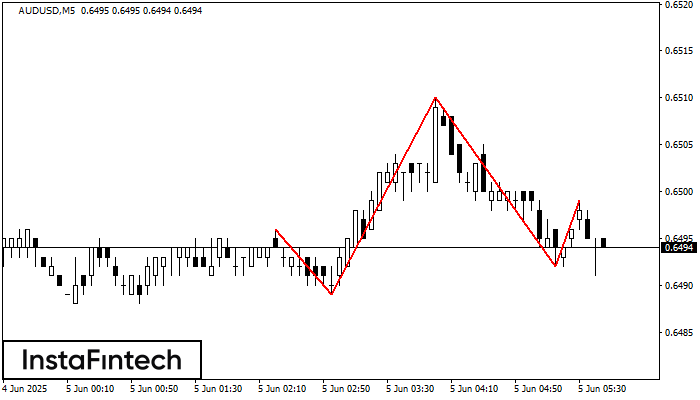
Corak teknikal yang dipanggil Head dan Shoulders telah muncul pada carta AUDUSD M5. Terdapat alasan yang berat untuk menunjukkan bahawa harga akan mengatasi garisan Neck 0.6489/0.6492 selepas Shoulder kanan telah
Carta masa M5 dan M15 mungkin mempunyai lebih banyak titik kemasukan palsu.
Open chart in a new window
Segi Empat Menurun
was formed on 05.06 at 04:06:17 (UTC+0)
signal strength 2 of 5

Berdasarkan carta M15, EURCHF telah membentuk Segi Empat Menurun. Corak ini menunjukkan kesinambungan aliran. Sempadan atas adalah 0.9348, sempadan bawah adalah 0.9337. Isyarat bermakna bahawa kedudukan pendek perlu dibuka selepas
Carta masa M5 dan M15 mungkin mempunyai lebih banyak titik kemasukan palsu.
Open chart in a new window
Double Top
was formed on 05.06 at 04:00:46 (UTC+0)
signal strength 3 of 5
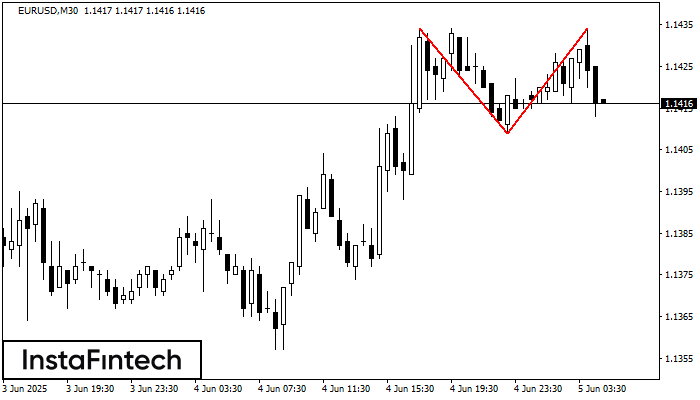
Corak Double Top telah dibentuk pada EURUSD M30. Isyarat bahawa aliran telah berubah dari aliran menaik ke aliran menurun. Mungkin, sekiranya asas corak 1.1409 ditembusi, pergerakan menurun akan berterusan
Open chart in a new window