

Actual patterns

Patterns are graphical models which are formed in the chart by the price. According to one of the technical analysis postulates, history (price movement) repeats itself. It means that the price movements are often similar in the same situations which makes it possible to predict the further development of the situation with a high probability.
Relevant patterns by InstaTrade is an easy-to-use service which allows you to be aware of latest changes in the market and react to clues from the market in time. In our service you will always find the latest and most relevant patterns on any pair and any timeframe.
Triple Bottom
was formed on 23.04 at 12:15:11 (UTC+0)
signal strength 2 of 5

The Triple Bottom pattern has formed on the chart of the USDJPY M15 trading instrument. The pattern signals a change in the trend from downwards to upwards in the case of breakdown of 142.25/141.96.
The M5 and M15 time frames may have more false entry points.
See Also
- All
- All
- Bearish Rectangle
- Bearish Symmetrical Triangle
- Bearish Symmetrical Triangle
- Bullish Rectangle
- Double Top
- Double Top
- Triple Bottom
- Triple Bottom
- Triple Top
- Triple Top
- All
- All
- Buy
- Sale
- All
- 1
- 2
- 3
- 4
- 5
Double Top
was formed on 06.06 at 05:05:28 (UTC+0)
signal strength 1 of 5
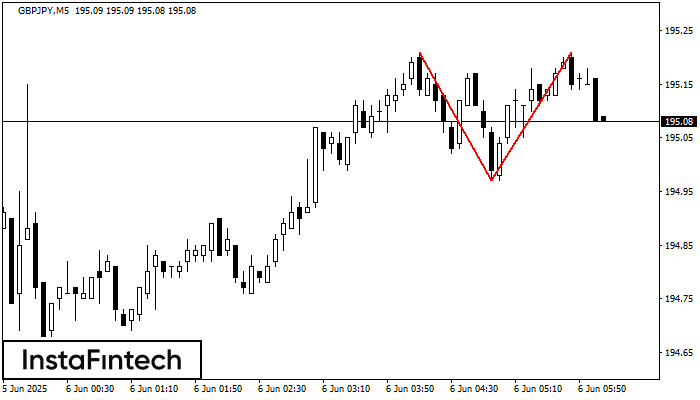
Corak pembalikan Double Top telah dibentuk pada GBPJPY M5. Ciri-ciri: sempadan atas %P0.000000; sempadan bawah 195.21; sempadan bawah 194.97; lebar corak adalah 24 mata. Dagangan menjual adalah lebih baik untuk
Carta masa M5 dan M15 mungkin mempunyai lebih banyak titik kemasukan palsu.
Open chart in a new window
Head dan Shoulders
was formed on 06.06 at 05:01:27 (UTC+0)
signal strength 4 of 5
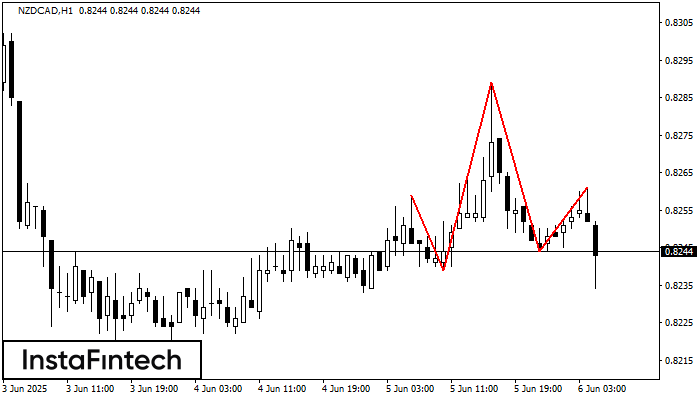
Corak teknikal yang dipanggil Head dan Shoulders telah muncul pada carta NZDCAD H1. Terdapat alasan yang berat untuk menunjukkan bahawa harga akan mengatasi garisan Neck 0.8239/0.8244 selepas Shoulder kanan telah
Open chart in a new window
Inverse Head dan Shoulder
was formed on 06.06 at 05:00:19 (UTC+0)
signal strength 4 of 5
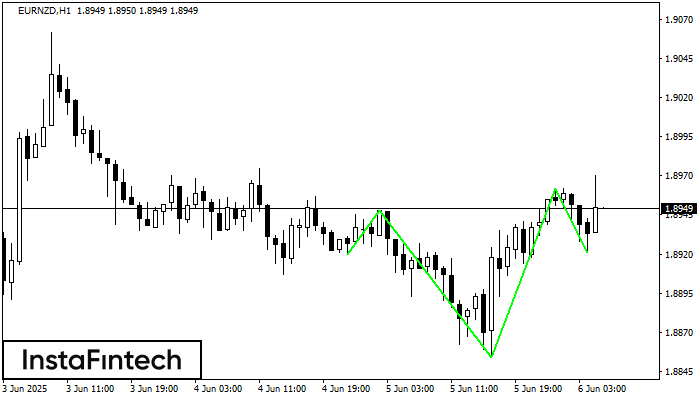
According to H1, EURNZD is shaping the technical pattern – the Inverse Head dan Shoulder. In case the Neckline 1.8948/1.8962 is broken out, the instrument is likely to move toward
Open chart in a new window


