

Actual patterns

Patterns are graphical models which are formed in the chart by the price. According to one of the technical analysis postulates, history (price movement) repeats itself. It means that the price movements are often similar in the same situations which makes it possible to predict the further development of the situation with a high probability.
Relevant patterns by InstaTrade is an easy-to-use service which allows you to be aware of latest changes in the market and react to clues from the market in time. In our service you will always find the latest and most relevant patterns on any pair and any timeframe.
Bullish Rectangle
was formed on 08.04 at 12:56:16 (UTC+0)
signal strength 1 of 5
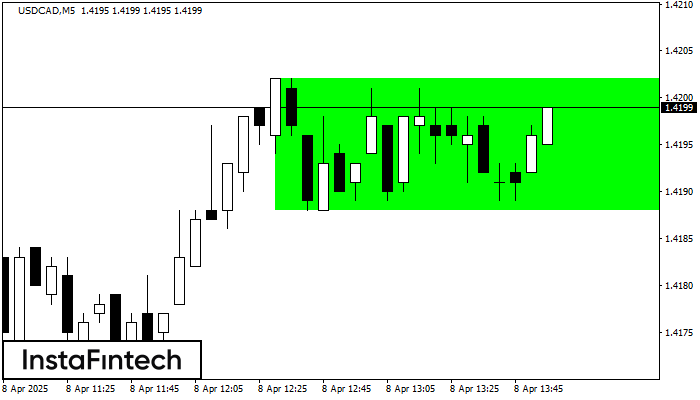
According to the chart of M5, USDCAD formed the Bullish Rectangle which is a pattern of a trend continuation. The pattern is contained within the following borders: the lower border 1.4188 – 1.4188 and upper border 1.4202 – 1.4202. In case the upper border is broken, the instrument is likely to follow the upward trend.
The M5 and M15 time frames may have more false entry points.
See Also
- All
- All
- Bearish Rectangle
- Bearish Symmetrical Triangle
- Bearish Symmetrical Triangle
- Bullish Rectangle
- Double Top
- Double Top
- Triple Bottom
- Triple Bottom
- Triple Top
- Triple Top
- All
- All
- Buy
- Sale
- All
- 1
- 2
- 3
- 4
- 5
Teratas Triple
was formed on 30.05 at 22:20:23 (UTC+0)
signal strength 1 of 5

Pola Teratas Triple telah terbentuk pada grafik instrumen trading GOLD M5. Pola tersebut merupakan pola reversal menampilkan karakteristik berikut: level resistance 4, levek support -193, dan lebar pola 613. Prakiraan
Rangka waktu M5 dan M15 mungkin memiliki lebih dari titik entri yang keliru.
Open chart in a new window
Kepala dan Bahu Terbalik
was formed on 30.05 at 21:50:24 (UTC+0)
signal strength 1 of 5

Menurut grafik M5, #AMZN menghasilkan pola yang disebut Kepala dan Bahu Terbalik. The Head ditetapkan di 201.64 sementara garis median The Neck ditetapkan di 204.52/205.01. Formasi Pola Kepala dan Bahu
Rangka waktu M5 dan M15 mungkin memiliki lebih dari titik entri yang keliru.
Open chart in a new window
Persegi Bearish
was formed on 30.05 at 21:36:36 (UTC+0)
signal strength 1 of 5

Menurut grafik dari M5, GBPAUD terbentuk Persegi Bearish yang merupakan pola dari kelanjutan tren. Pola terkandung di dalam batas berikut: batas lebih rendah 2.0897 – 2.0897 dan batas atas 2.0908
Rangka waktu M5 dan M15 mungkin memiliki lebih dari titik entri yang keliru.
Open chart in a new window


