Voir aussi


 26.01.2023 07:58 PM
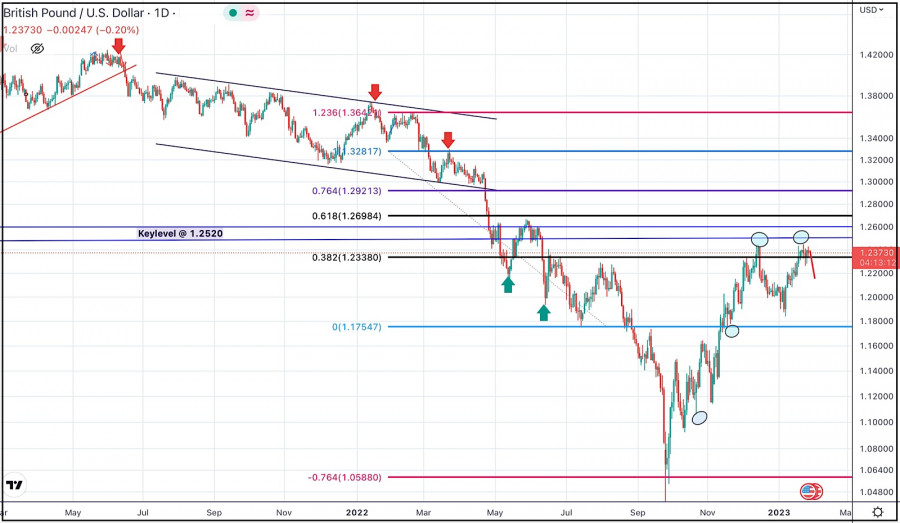
Previously, the GBP/USD pair remained under bearish pressure to challenge the prominent daily bottom established around 1.1750 which was bypassed shortly after.
However, considerable bullish momentum was initiated around 1.0400-1.0600 that could prevent further bearish decline.
As the market was pursuing the current bullish movement, the newly-established ascending bottoms around 1.1150 and 1.1750 remained defended by the bulls. That's why, further bullish continuation above 1.1765 was expected.
Price action around 1.2340 was being watched for bearish rejection and a short-term SELL Entry. It was running in profits until the current bullish bounce has been expressed.
Please take into consideration that bullish breakout above 1.2340 will probably enable further advancement towards 1.2700.
On the other hand, another bearish pullback towards the price levels of 1.1750 should be expected for another long-term BUY Entry with initial target around 1.2350.
You have already liked this post today
*The market analysis posted here is meant to increase your awareness, but not to give instructions to make a trade.
Au début de la session américaine, la paire EUR/USD se négocie autour de 1,1378 dans le canal de tendance baissière formé le 17 avril, montrant des signes d'épuisement
Liens utiles : Mes autres articles sont disponibles dans cette section Cours InstaForex pour débutants Analyses Populaires Ouvrir un compte de trading Important : Les débutants en trading forex doivent
Tôt dans la session américaine, l'or se négocie autour de 3 384, au-dessus d'un support clé et rebondissant après avoir atteint 3 267. On s'attend à ce que l'or regagne
Liens utiles : Mes autres articles sont disponibles dans cette section Cours InstaForex pour débutants Analyses Populaires Ouvrir un compte de trading Important : Les débutants en trading forex doivent
Avec l'apparition des figures de "Divergent" et de "Descending Broadening Wedge" sur le graphique de 4 heures de la paire de devises croisées AUD/JPY, bien que le mouvement
Sur le graphique de 4 heures de la paire de devises principale USD/JPY, on peut observer que l'indicateur Stochastic Oscillator forme un modèle de Double Bottom tandis que le mouvement
Tôt dans la session américaine, l'or se négocie autour du niveau de 3 310, où il se situe à la 21SMA et à l'intérieur d'un motif en triangle symétrique formé
Notre plan de trading pour les prochaines heures est de vendre en dessous de 1.1410 avec des cibles à 1.1370 et 1.1230. L'indicateur eagle donne un signal négatif, nous pensons
Liens utiles : Mes autres articles sont disponibles dans cette section Cours InstaForex pour débutants Analyses Populaires Ouvrir un compte de trading Important : Les débutants en trading forex doivent
D'un autre côté, si la pression baissière prévaut et que l'euro se consolide en dessous de 1.1370, cela pourrait être interprété comme un signal de vente avec des objectifs
Your IP address shows that you are currently located in the USA. If you are a resident of the United States, you are prohibited from using the services of InstaFintech Group including online trading, online transfers, deposit/withdrawal of funds, etc.
If you think you are seeing this message by mistake and your location is not the US, kindly proceed to the website. Otherwise, you must leave the website in order to comply with government restrictions.
Why does your IP address show your location as the USA?
Please confirm whether you are a US resident or not by clicking the relevant button below. If you choose the wrong option, being a US resident, you will not be able to open an account with InstaTrade anyway.
We are sorry for any inconvenience caused by this message.

