Voir aussi


 30.12.2022 05:48 AM
Early in the European session, Gold (XAU/USD) was trading around 1,816.30, above the 21 SMA and below the strong resistance at 1,823.
Yesterday, gold managed to accelerate its bullish movement after bouncing around 1,804. The strength of gold was caused by a fall in US bond yields, which weakened the US dollar and helped gold to approach the levels of 1,812 - 1,818.
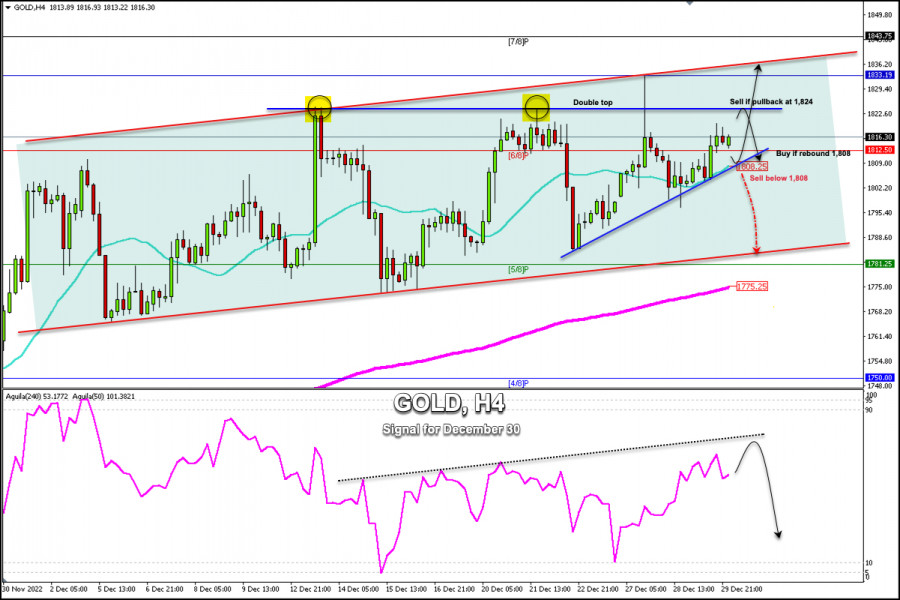
On the technical level, according to the 4-hour charts, we can see the XAU/USD pair maintains the upward trend, it is expected to reach $1,824 again and climb up to the December maximum of 1,833.
In the graph, we can see that gold has formed a double top (technical reversal pattern). If in the next few hours, it reaches this area of 1,823, a triple top could be confirmed and we could expect a technical correction towards the 21 SMA in 1,808.
On the other hand, if in the next few hours, gold falls below 1,812, it is likely that there will be a slowdown in the bullish force and the price could reach the area of 1,808. A daily close below this level could mean a bearish movement and the price could reach 1,785 and drop even towards 5/8 Murray at 1,781.
The XAU/USD pair is likely to consolidate below 1,824 and above 1,808 in the next few hours. This range zone could define our next moves to buy or sell. Only daily close below the 21 SMA could mean a bearish acceleration and will be the key to sell in the next few days with targets at 1,775 (200 EMA).
You have already liked this post today
*The market analysis posted here is meant to increase your awareness, but not to give instructions to make a trade.
Liens utiles : Mes autres articles sont disponibles dans cette section Cours InstaForex pour débutants Analytique Populaire Ouvrir un compte de trading Important : Les débutants en trading forex doivent
Liens utiles : Mes autres articles sont disponibles dans cette section Cours pour débutants par InstaForex Analytique Populaire Ouvrir un compte de trading Important : Les débutants en trading forex
Avec l'apparition d'une divergence entre le mouvement des prix de la paire de devises croisées EUR/JPY et l'indicateur Oscillateur Stochastique, ainsi que la présence du modèle haussier 123 suivi
Sur le graphique de 4 heures, la paire de devises GBP/AUD semble évoluer en dessous de son EMA (21) et l'indicateur Stochastic Oscillator est en condition de croisement VENTE. Ainsi
Notre plan de trading pour les prochaines heures est de vendre de l'or en dessous de 3,224, avec des objectifs à 3,203 et 3,156. Nous devons rester attentifs à tout
Sur le graphique 4 heures de l'instrument de commodité pétrole brut, le modèle Tête & Épaules Inversé, le modèle haussier 123 et la divergence entre le mouvement du prix #CL
Comptes PAMM
InstaForex

Your IP address shows that you are currently located in the USA. If you are a resident of the United States, you are prohibited from using the services of InstaFintech Group including online trading, online transfers, deposit/withdrawal of funds, etc.
If you think you are seeing this message by mistake and your location is not the US, kindly proceed to the website. Otherwise, you must leave the website in order to comply with government restrictions.
Why does your IP address show your location as the USA?
Please confirm whether you are a US resident or not by clicking the relevant button below. If you choose the wrong option, being a US resident, you will not be able to open an account with InstaTrade anyway.
We are sorry for any inconvenience caused by this message.

