empty
29.10.2021 12:30 PM
Technical analysis recommendations of EUR/USD and GBP/USD on October 29

EUR/USD

This image is no longer relevant

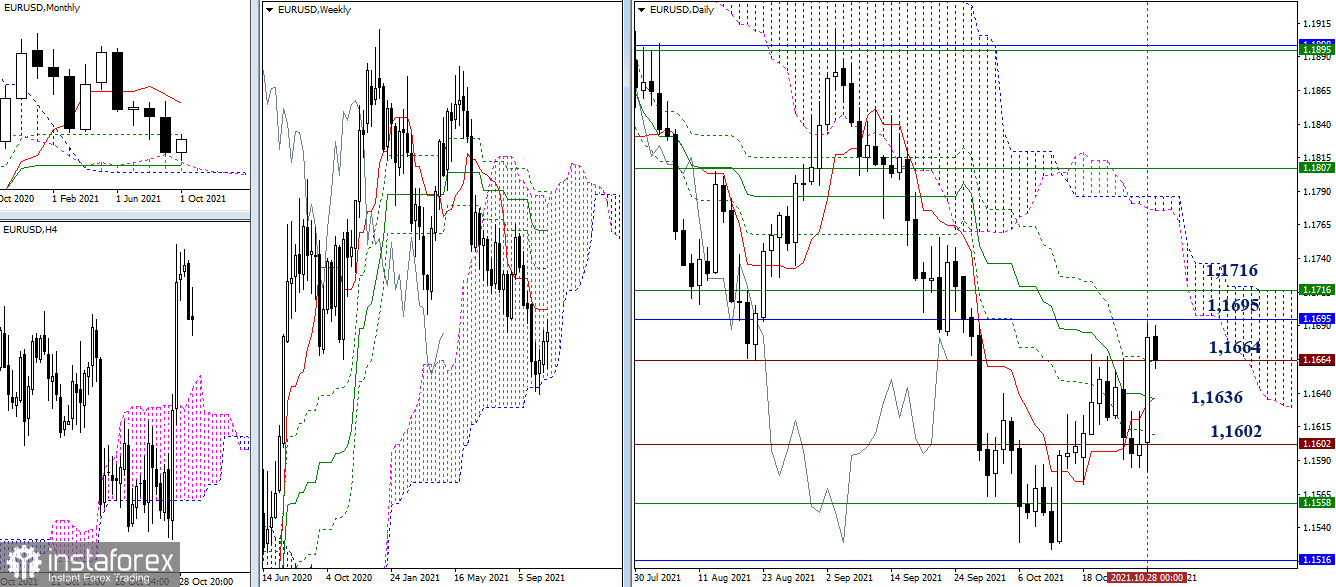
The end of the week and month is approaching. Yesterday, the bulls tried to break through the historical level of 1.1664. If the result can be consolidated in a weekly format, then the question of breaking through the resistance area of 1.1695 - 1.1716 (monthly Fibo Kijun + weekly Tenkan) will arise.

The failure to overcome the level of 1.1664, formation of a long upper shadow of the weekly candle and a return to the supports of 1.1636 (daily cross) or 1.1602 (historical level), will bring uncertainty back to the market.

This image is no longer relevant

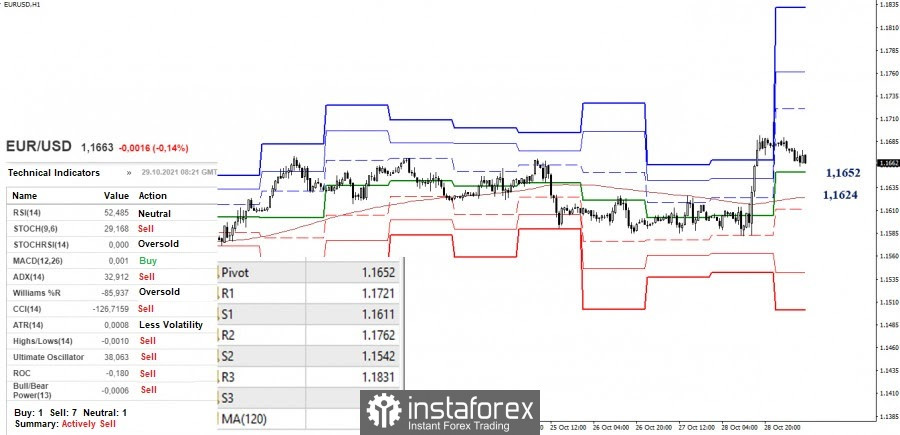
At the moment, there is a decline and test of the central pivot level (1.1652) in the smaller timeframes. The line of the weekly long-term trend (1.1624) is important for the bulls. In the case of consolidation below, the bears will regain their advantages. Their next pivot points will be the support of the classic pivot levels 1.1611 - 1.1542 - 1.1501. But if a rebound from the encountered support levels occurs in the near future and the high (1.1692) is updated, then bullish prospects will be represented by the resistances of the classic pivot levels 1.1721 - 1.1762 - 1.1831.

GBP/USD

This image is no longer relevant

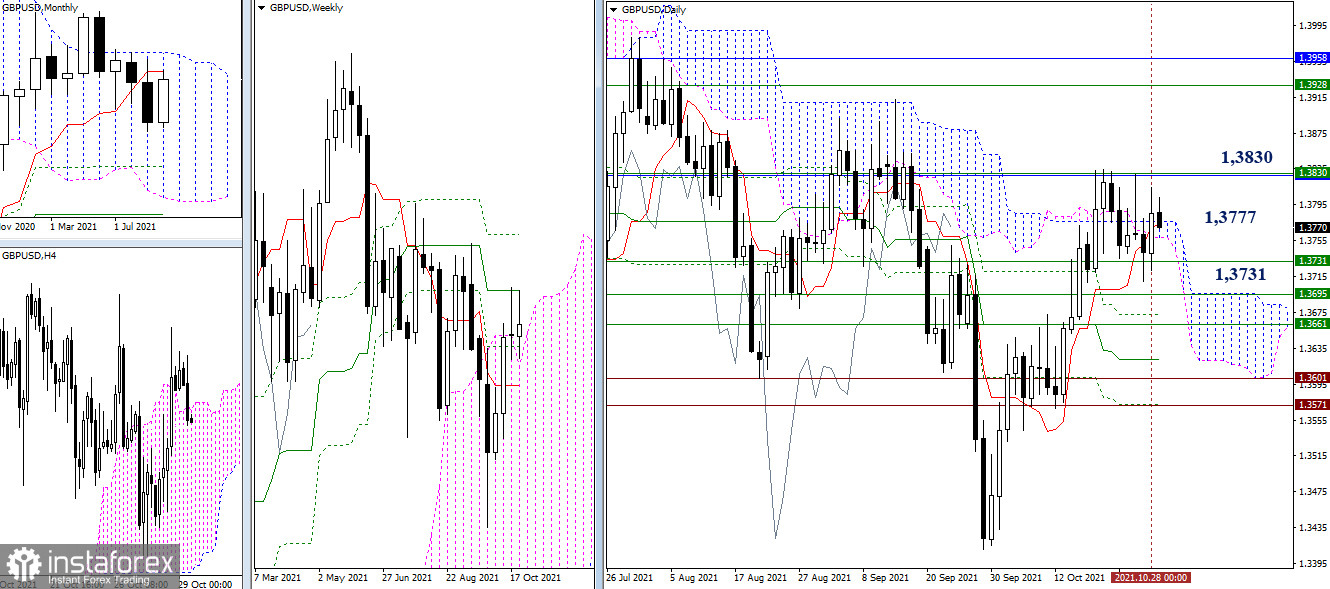
The situation could not be changed dramatically despite yesterday's bullish activity. The pair remained within the borders of 1.3830 (monthly short-term trend + weekly medium-term trend) and 1.3731 (weekly Fibo Kijun). In this case, the center of attraction is still the daily cloud (1.3777). Therefore, the possible prospects remained unchanged.

The breakdown of the support at 1.3731 will open the way to the next levels of 1.3695 (upper border of the weekly cloud) and 1.3661 (weekly short-term trend). The breakdown of the resistance at 1.3830 will make the zone of 1.3928-58 (weekly Fibo Kijun + monthly Senkou Span B) benchmarks.

This image is no longer relevant

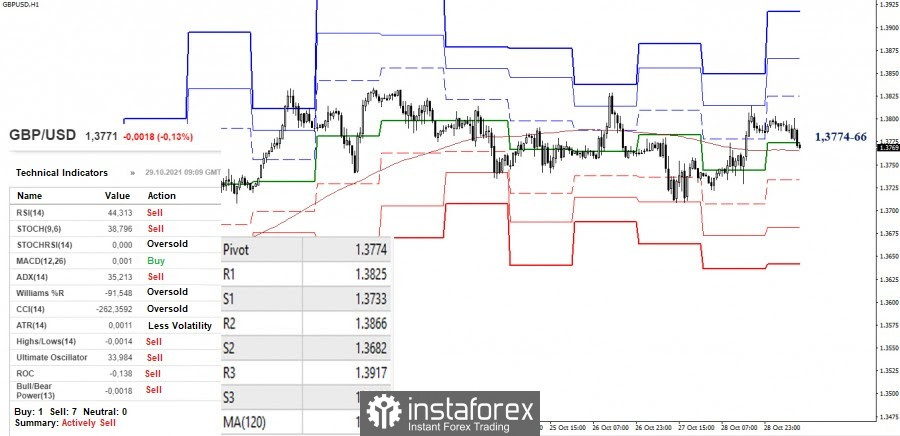
The key levels in the smaller timeframes (central pivot level 1.3774 + weekly long-term trend 1.3766) are currently joining forces with the daily center of gravity (1.3777). This area is currently being tested, so we can say that the market is dominated by uncertainty. Today's upward targets are set at 1.3825 - 1.3866 - 1.3917 (classic pivot levels), while the downward targets are at 1.3733 - 1.3682 - 1.3641 (classic pivot levels).

***

Ichimoku Kinko Hyo (9.26.52) and Kijun-sen levels in the higher time frames, as well as classic Pivot Points and Moving Average (120) on the H1 chart, are used in the technical analysis of the trading instruments.

Evangelos Poulakis,
Analytical expert of InstaTrade
© 2007-2025

Recommended Stories

Prévisions Forex 30/04/2025 : EUR/USD, AUD/USD, USD/JPY, Or et Bitcoin

Liens utiles : Mes autres articles sont disponibles dans cette section Cours InstaForex pour débutants Analyses Populaires Ouvrir un compte de trading Important : Les débutants en trading forex doivent

Sebastian Seliga 16:31 2025-04-30 UTC+2

Signaux de trading pour l'OR (XAU/USD) le 30 avril 2025 : acheter au-dessus de 3 270 $ (21 SMA - 6/8 Murray)

Tôt dans la session américaine, l'or se négocie autour de 3 384, au-dessus d'un support clé et rebondissant après avoir atteint 3 267. On s'attend à ce que l'or regagne

Dimitrios Zappas 15:07 2025-04-30 UTC+2

Prévisions Forex du 29/04/2025 : EUR/USD, GBP/USD, Or, Ethereum et Bitcoin

Liens utiles : Mes autres articles sont disponibles dans cette section Cours InstaForex pour débutants Analyses Populaires Ouvrir un compte de trading Important : Les débutants en trading forex doivent

Sebastian Seliga 08:41 2025-04-30 UTC+2

Analyse technique du mouvement intrajournalier des paires de devises croisées AUD/JPY, mercredi 30 avril 2025.

Avec l'apparition des figures de "Divergent" et de "Descending Broadening Wedge" sur le graphique de 4 heures de la paire de devises croisées AUD/JPY, bien que le mouvement

Arief Makmur 06:19 2025-04-30 UTC+2

Analyse technique du mouvement intraday du prix des principales paires de devises USD/JPY, mercredi 30 avril 2025.

Sur le graphique de 4 heures de la paire de devises principale USD/JPY, on peut observer que l'indicateur Stochastic Oscillator forme un modèle de Double Bottom tandis que le mouvement

Arief Makmur 06:17 2025-04-30 UTC+2

Signaux de Trading pour l'OR (XAU/USD) pour les 29-30 avril 2025 : acheter au-dessus de 3 310 $ (21 SMA - 7/8 Murray)

Tôt dans la session américaine, l'or se négocie autour du niveau de 3 310, où il se situe à la 21SMA et à l'intérieur d'un motif en triangle symétrique formé

Dimitrios Zappas 18:10 2025-04-29 UTC+2

Signaux de Trading pour EUR/USD pour le 29-30 avril 2025 : vendre en dessous de 1.1410 (triangle symétrique - 7/8 Murray)

Notre plan de trading pour les prochaines heures est de vendre en dessous de 1.1410 avec des cibles à 1.1370 et 1.1230. L'indicateur eagle donne un signal négatif, nous pensons

Dimitrios Zappas 17:52 2025-04-29 UTC+2

Prévisions Forex du 28/04/2025 : EUR/USD, GBP/USD, USD/JPY, USDX, Or et Bitcoin

Liens utiles : Mes autres articles sont disponibles dans cette section Cours InstaForex pour débutants Analyses Populaires Ouvrir un compte de trading Important : Les débutants en trading forex doivent

Sebastian Seliga 18:34 2025-04-28 UTC+2

Signaux de trading pour EUR/USD pour le 28-30 avril 2025 : vendre en dessous de 1,1370 (21 SMA - 7/8 Murray)

D'un autre côté, si la pression baissière prévaut et que l'euro se consolide en dessous de 1.1370, cela pourrait être interprété comme un signal de vente avec des objectifs

Dimitrios Zappas 16:29 2025-04-28 UTC+2

Signaux de trading pour l'OR (XAU/USD) du 28 au 30 avril 2025 : acheter au-dessus de 3 270 $ (21 SMA - 7/8 Murray)

L'indicateur Eagle montre des signaux de survente, nous pensons donc que l'or pourrait reprendre son cycle haussier à court terme après une correction technique et atteindre le seuil psychologique

Dimitrios Zappas 16:25 2025-04-28 UTC+2
Can't speak right now?
Ask your question in the chat.
 

Dear visitor,

Your IP address shows that you are currently located in the USA. If you are a resident of the United States, you are prohibited from using the services of InstaFintech Group including online trading, online transfers, deposit/withdrawal of funds, etc.

If you think you are seeing this message by mistake and your location is not the US, kindly proceed to the website. Otherwise, you must leave the website in order to comply with government restrictions.

Why does your IP address show your location as the USA?

  • - you are using a VPN provided by a hosting company based in the United States;
  • - your IP does not have proper WHOIS records;
  • - an error occurred in the WHOIS geolocation database.

Please confirm whether you are a US resident or not by clicking the relevant button below. If you choose the wrong option, being a US resident, you will not be able to open an account with InstaTrade anyway.

We are sorry for any inconvenience caused by this message.