See also


 28.04.2025 07:19 PM
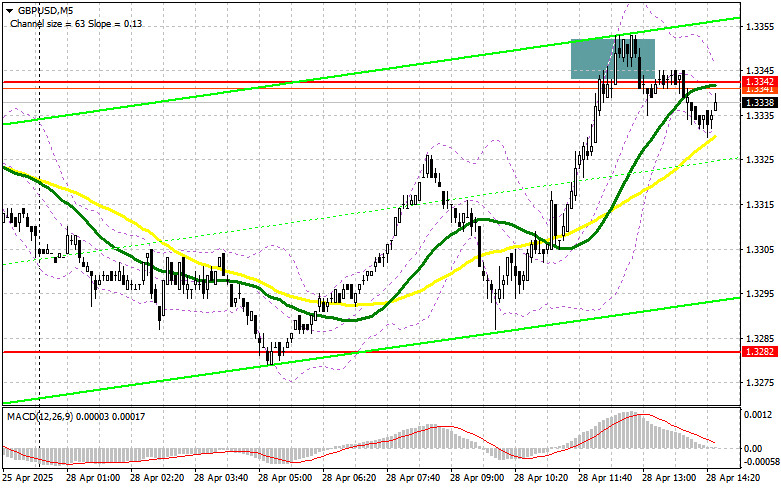
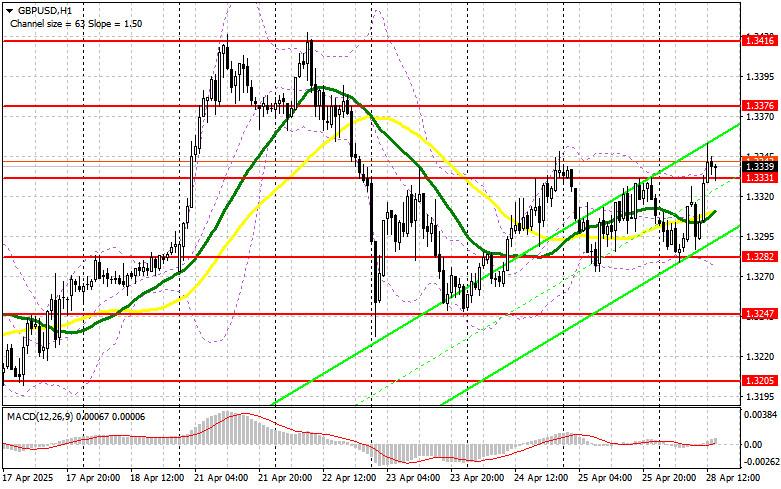
The rise in retail sales in the UK, according to data from the Confederation of British Industry, triggered some pound buying in the first half of the day, but it wasn't enough to resume a strong bullish market. Given that there is no important U.S. data in the second half of the day, pound buyers may try to maintain their advantage. However, under current conditions, it's better to act on buying from lower levels. Active buying and the formation of a false breakout around the new intermediate support at 1.3331, established during the first half of the day, would provide a good entry point for long positions aiming for a recovery toward the 1.3376 resistance. A breakout and downward retest of this range would create a new long entry point, targeting an update of 1.3416, allowing the bullish market to regain control. The ultimate target will be the 1.3462 level, where I plan to take profit.
If GBP/USD declines and bulls show no activity at 1.3331 in the second half of the day, pressure on the pair will return. In that case, only a false breakout around 1.3282 would offer a good opportunity to open long positions. Otherwise, I will consider buying GBP/USD on a rebound from the 1.3247 support area, targeting a 30–35 point intraday correction.
Sellers showed themselves in the first half of the day, but a significant decline didn't occur due to strong UK data. In case of another upward movement in the pound, I plan to act around the nearest resistance at 1.3376. A false breakout at this level would provide a selling entry point targeting a drop to 1.3331 support. A breakout and upward retest of this range would trigger stop-loss orders and open the way to 1.3282, slightly above where the moving averages are located, favoring the bulls. The ultimate target would be the 1.3247 level, where I plan to take profit.
If demand for the pound remains strong and bears show no resistance around 1.3376, it would be better to postpone selling until testing the 1.3416 resistance — the monthly high. I would only open short positions there after a failed consolidation. If there is no downward movement even there, I will look for short entries around 1.3462, but only for a 30–35 point intraday correction.
Commitments of Traders (COT) Report:
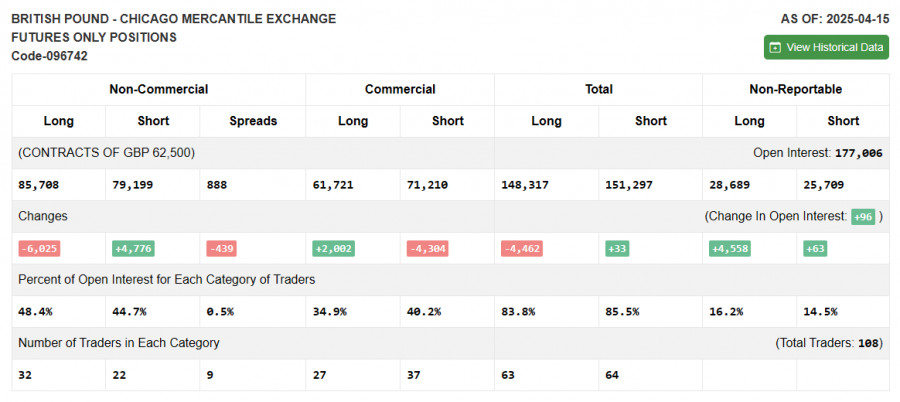
The COT report for April 15 showed an increase in short positions and a reduction in long positions. Interestingly, even with these figures, the pound has demonstrated fairly confident growth against the dollar. However, it's important to note that this data is delayed, and the recent major GBP/USD rally is directly tied to Donald Trump's tariff policy stance and dissatisfaction with Federal Reserve Chairman Jerome Powell — a factor putting more pressure on the dollar than supporting the pound. The latest COT report indicated that long non-commercial positions fell by 6,025 to 85,708, while short non-commercial positions rose by 4,776 to 79,199. As a result, the gap between long and short positions decreased by 439.
Indicator Signals:
Moving Averages:Trading is taking place above the 30- and 50-day moving averages, indicating an attempt by buyers to regain market control.Note: The periods and prices of moving averages are based on the author's analysis on the H1 hourly chart and differ from the classic definitions on the D1 daily chart.
Bollinger Bands:In case of a decline, the lower boundary of the indicator at around 1.3282 will act as support.
Indicator descriptions: • Moving average: identifies the current trend by smoothing out volatility and noise (50-period marked in yellow; 30-period in green). • MACD indicator (Moving Average Convergence/Divergence): fast EMA 12-period, slow EMA 26-period, SMA 9-period. • Bollinger Bands: period 20. • Non-commercial traders: speculators such as individual traders, hedge funds, and large institutions using the futures market for speculative purposes and meeting certain criteria. • Long non-commercial positions: the total number of open long positions by non-commercial traders. • Short non-commercial positions: the total number of open short positions by non-commercial traders. • Net non-commercial position: the difference between short and long positions among non-commercial traders.
You have already liked this post today
*The market analysis posted here is meant to increase your awareness, but not to give instructions to make a trade.
Analysis of Thursday's Trades 1H Chart of GBP/USD The GBP/USD pair didn't even attempt a correction on Thursday. While the euro faced bearish pressure from weak business activity indices
Analysis of Thursday's Trades 1H Chart of EUR/USD On Thursday, the EUR/USD currency pair corrected to the nearest support level on the hourly timeframe, which was at 1.1267. Multiple factors
The GBP/USD currency pair broke out of its sideways channel through the upper boundary, but it is in no hurry to continue rising. Traders appear to be gathering momentum
On Thursday, the EUR/USD currency pair traded lower, which can be considered an exception to the general trend. Nearly all macroeconomic reports during the day were unfavorable for the euro
Analysis of Wednesday's Trades 1H Chart of GBP/USD The GBP/USD pair maintained its upward trend on Wednesday, a movement that has developed over the past two weeks. Recall that
Analysis of Wednesday's Trades 1H Chart of EUR/USD On Wednesday, the EUR/USD currency pair continued its upward movement calmly and steadily. The price broke through the 1.1267 level, which
The GBP/USD currency pair also resumed its upward movement on Wednesday. The rise of the British pound, which in reality still reflects the fall of the US dollar, began overnight
The EUR/USD currency pair resumed its upward movement on Wednesday, and it is now safe to say that the uptrend is present not only in the hourly timeframe but also
Analysis of Tuesday's Trades 1H Chart of GBP/USD The GBP/USD pair mainly traded sideways on Tuesday, but early Wednesday morning it surged upward. On the 4-hour timeframe, it's clear that
Analysis of Tuesday's Trades 1H Chart of EUR/USD On Tuesday, the EUR/USD currency pair traded sideways, but it resumed its upward movement early Wednesday morning. This indicates that the ongoing
InstaTrade
video analytics

Your IP address shows that you are currently located in the USA. If you are a resident of the United States, you are prohibited from using the services of InstaFintech Group including online trading, online transfers, deposit/withdrawal of funds, etc.
If you think you are seeing this message by mistake and your location is not the US, kindly proceed to the website. Otherwise, you must leave the website in order to comply with government restrictions.
Why does your IP address show your location as the USA?
Please confirm whether you are a US resident or not by clicking the relevant button below. If you choose the wrong option, being a US resident, you will not be able to open an account with InstaTrade anyway.
We are sorry for any inconvenience caused by this message.


