empty
04.04.2025 09:38 AM
EUR/USD and GBP/USD April 4 – Technical Analysis

EUR/USD

This image is no longer relevant

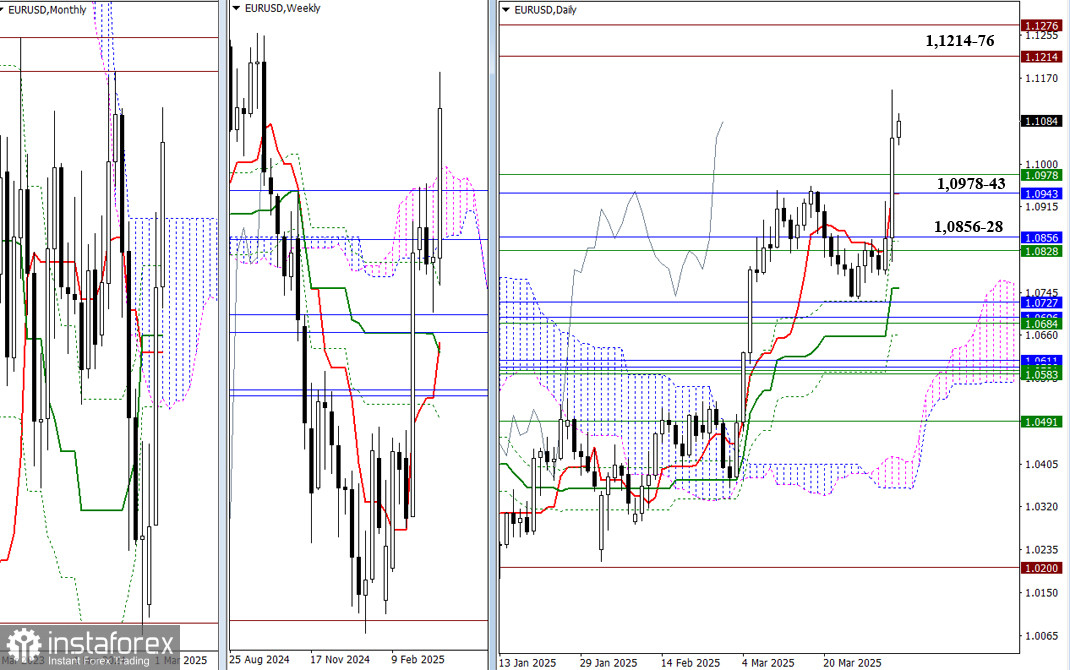
After several attempts and three weeks of consolidation, the bulls finally launched a breakout, allowing them to close yesterday well above the resistance levels of the Ichimoku Cloud on the monthly (1.0943) and weekly (1.0978) timeframes. Today marks the weekly close, and the bulls need to hold on to these gains. If the upward move continues, the pair may test the previous highs (1.1214 – 1.1276). If the gains are lost, the levels that have been breached may now act as support. Potential downside targets include the zones around 1.0978 – 1.0943 and 1.0856 – 1.0828.

This image is no longer relevant

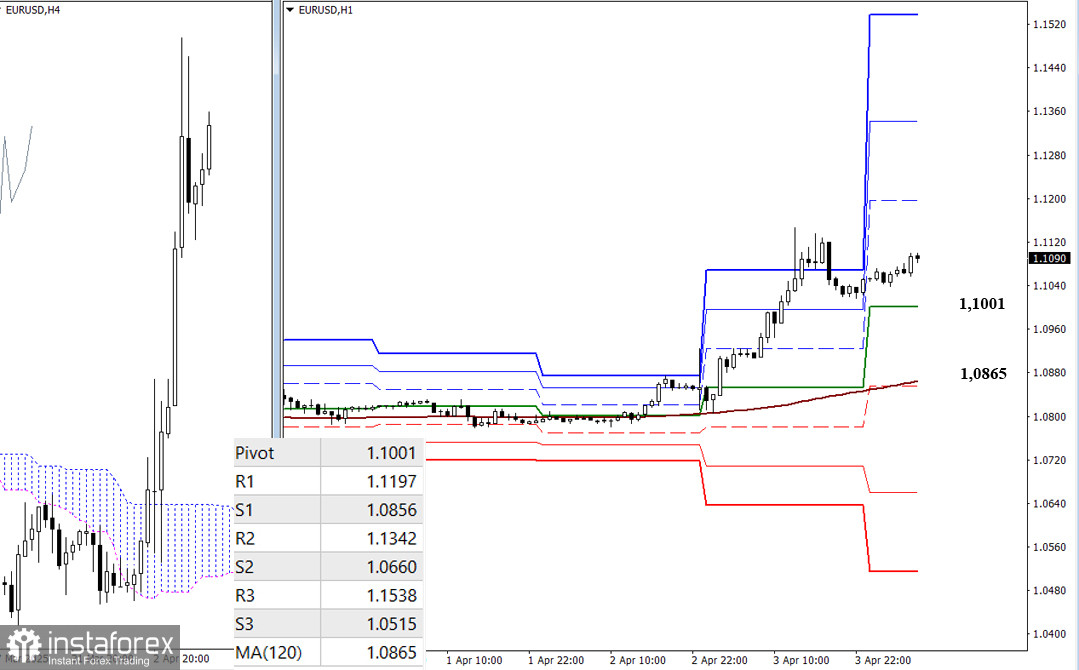
Yesterday's momentum significantly expanded the boundaries of the classic Pivot levels. The resistance levels are at 1.1197 – 1.1342 – 1.1538 for further upward movement. Should the bears opt for a corrective pullback, they will encounter key levels at 1.1001 (daily central Pivot level) and 1.0865 (weekly long-term trend). A break below and reversal of the trend would allow the bears to shift the current balance of power in their favor. Further development of bearish sentiment would lead the pair toward the support levels of the classic Pivot points (1.0856 – 1.0660 – 1.0515).

***

GBP/USD

This image is no longer relevant

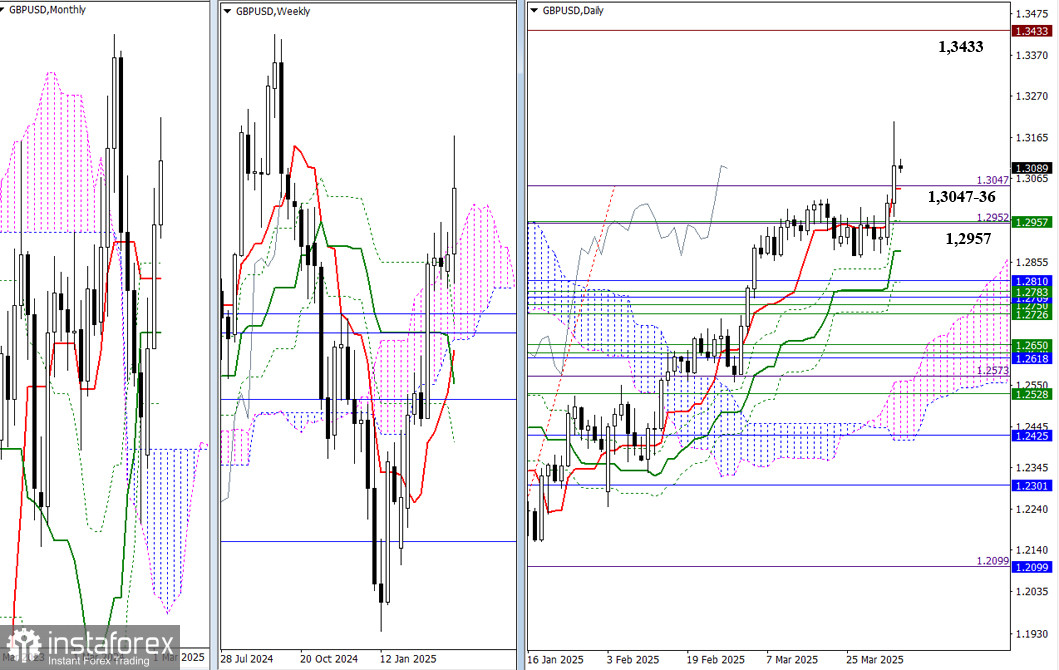
Out of the three weeks of uncertainty, the bulls were the first to break out. They pushed past the final daily target level (1.3047) without a retest. As the week draws to a close, holding on to the gains is crucial. If the upward movement continues, the bulls will aim for the previous high (1.3433). A breakout above that level would signal the end of the current monthly correction. If the bulls fail, their opponents could reclaim the advantage by breaking below the daily short-term trend support (1.3036) and quickly return the pair to the previous consolidation zone, centered around the upper boundary of the weekly Ichimoku cloud (1.2957).

This image is no longer relevant

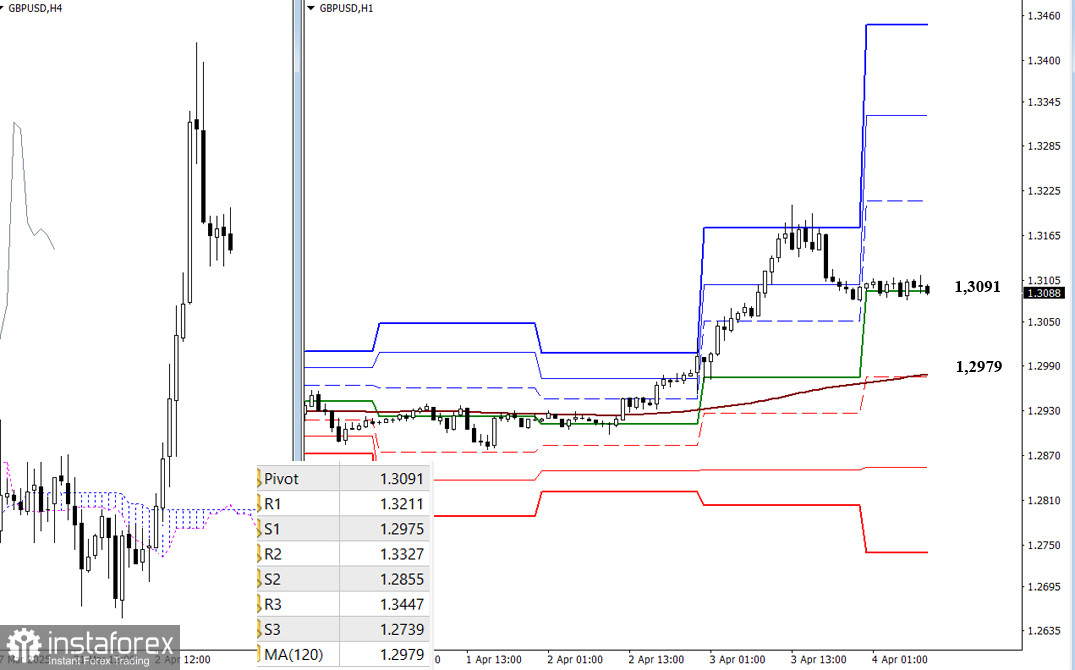
On the lower timeframes, the market is currently hovering around the central Pivot level (1.3091). Continuing the corrective pullback could lead the pair to test the weekly long-term trend level (1.2979), which currently reflects the existing balance of power. A break below this level would shift the main advantage to the bears. Further strengthening of bearish momentum could bring the pair down to the classic Pivot support levels at 1.2855 and 1.2739. If the bulls halt the correction at this stage, further upside potential would be realized through resistance levels at 1.3211 – 1.3327 – 1.3447.

***

Technical Analysis Components:
  • Higher Timeframes: Ichimoku Kinko Hyo (9.26.52) and Fibonacci Kijun levels
  • H1: Classic Pivot Points and 120-period Moving Average (weekly long-term trend)
Evangelos Poulakis,
Analytical expert of InstaTrade
© 2007-2025

Recommended Stories

EUR/USD. Analysis and Forecast

At the start of the new week, the EUR/USD pair has gained upward momentum on the back of a weaker US dollar. From a technical standpoint, last week's break below

Irina Yanina 17:58 2025-05-19 UTC+2

Trading Signals for EUR/USD for May 19-21, 2025: sell below 1.1285 (200 EMA - GAP)

Our trading plan for the coming hours is to sell the euro below the top of the downtrend channel, with targets at 1.1189, and to cover the gap left last

Dimitrios Zappas 14:30 2025-05-19 UTC+2

Trading Signals for GOLD for May 19-21, 2025: sell below $3,247 (200 EMA - GAP)

Gold left another gap on May 8 around 3,325 and is likely to break above 3,250. The outlook could be bullish, and we could expect it to cover this

Dimitrios Zappas 14:29 2025-05-19 UTC+2

Forex forecast 19/05/2025: EUR/USD, GBP/USD, USD/JPY, USD/CAD, Gold, Ethereum and Bitcoin

Useful links: My other articles are available in this section InstaForex course for beginners Popular Analytics Open trading account Important: The begginers in forex trading need to be very careful

Sebastian Seliga 10:52 2025-05-19 UTC+2

EUR/USD. May 19th. The Euro Remains Under Pressure

On Friday, the EUR/USD pair continued its moderate decline. A close below the 127.2% Fibonacci level at 1.1181 was recorded, but bears failed to build on that success. The current

Samir Klishi 10:45 2025-05-19 UTC+2

Forecast for GBP/USD on May 19, 2025

On the hourly chart, the GBP/USD pair continued to move sideways on Friday, fluctuating between the levels of 1.3205 and 1.3344. Following a rejection from the resistance zone of 1.3344–1.3357

Samir Klishi 10:36 2025-05-19 UTC+2

Technical Analysis of Intraday Price Movement of Gold Commodity Instrument, Monday May 19, 2025.

On the 4-hour chart, the Stochastic Oscillator indicator appears to be crossing BUY, coupled with the price movement moving above the WMA (21) and the appearance of a Bullish

Arief Makmur 07:58 2025-05-19 UTC+2

Technical Analysis of Intraday Price Movement of EUR/JPY Cross Currency Pairs, Monday May 19, 2025.

Although Sellers still dominate EUR/JPY on its 4-hour chart, this is confirmed by its price movement which is moving below the WMA (21) which also has a downward slope

Arief Makmur 07:58 2025-05-19 UTC+2

EUR/USD Forecast for May 19, 2025

On Friday, the euro failed to sustain its upward movement, but it also didn't fall below the daily-scale MACD indicator line—the day closed with a black candlestick, but still above

Laurie Bailey 07:00 2025-05-19 UTC+2

GBP/USD Forecast for May 19, 2025

On Friday, the British pound failed to break above the resistance level 1.3311. Even the "head and shoulders" pattern on the Marlin oscillator couldn't help—the price extended its sideways movement

Laurie Bailey 07:00 2025-05-19 UTC+2
Can't speak right now?
Ask your question in the chat.
 

Dear visitor,

Your IP address shows that you are currently located in the USA. If you are a resident of the United States, you are prohibited from using the services of InstaFintech Group including online trading, online transfers, deposit/withdrawal of funds, etc.

If you think you are seeing this message by mistake and your location is not the US, kindly proceed to the website. Otherwise, you must leave the website in order to comply with government restrictions.

Why does your IP address show your location as the USA?

  • - you are using a VPN provided by a hosting company based in the United States;
  • - your IP does not have proper WHOIS records;
  • - an error occurred in the WHOIS geolocation database.

Please confirm whether you are a US resident or not by clicking the relevant button below. If you choose the wrong option, being a US resident, you will not be able to open an account with InstaTrade anyway.

We are sorry for any inconvenience caused by this message.