See also


 14.03.2025 04:25 PM
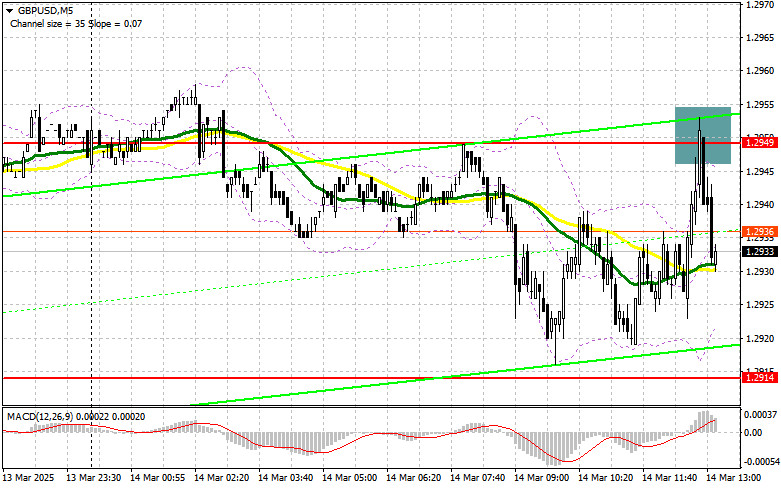
In my morning forecast, I focused on the 1.2949 level and planned to base my trading decisions on it. Let's examine the 5-minute chart to see what happened. A rise followed by a false breakout at 1.2949 provided a good selling opportunity, leading to a 20-point decline in the pair. The technical outlook remains unchanged for the second half of the day.
The British pound showed only a slight decline following news that UK GDP contracted in January and came in below economists' expectations. However, this downward move wasn't enough to push the pair out of its trading range, meaning that market focus has now shifted to U.S. data.
The University of Michigan Consumer Sentiment Index and inflation expectations may put pressure on the U.S. dollar if the data comes in weaker than expected, potentially helping GBP/USD continue its upward movement.
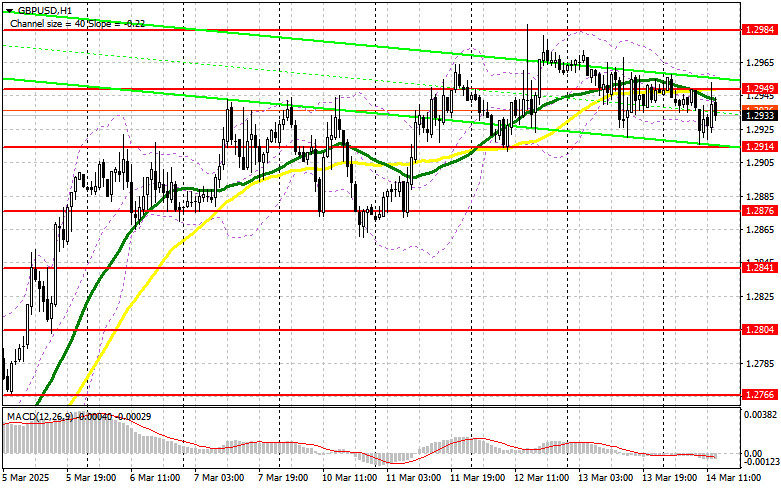
I will stick to the morning scenario and look for buying opportunities from the nearest support at 1.2914. A false breakout at this level will provide a good long entry point, targeting a recovery toward resistance at 1.2949, where the pair is currently trading. A break and retest of this range from above will confirm a strong buy entry, with an upward target of 1.2984, signaling a return to a bullish market. The ultimate target will be 1.3028, where I plan to take profits.
If GBP/USD declines and fails to find buyers around 1.2914, selling pressure on the pound will increase, potentially triggering a stronger sell-off. In this case, I will consider buying only after a false breakout near the 1.2876 low. If the pair drops further, I will open long positions on a rebound from 1.2841, targeting a 30-35 point intraday upward correction.
Sellers took advantage of weak GDP data, but even this was not enough to trigger a significant decline, suggesting that there is little interest in selling the pound at current levels.
The main focus in the second half of the day will remain on defending resistance at 1.2949. A false breakout at this level, similar to the morning scenario, will provide a good short entry point, targeting a correction toward 1.2914. A break and retest of this level from below will lead to stop-loss triggers, potentially pushing the pair lower to 1.2876, which would be a significant correction. The ultimate bearish target is 1.2841, where I plan to take profits. A test of this level may temporarily halt the pound's upward trend.
If demand for the pound remains strong in the second half of the day and bears fail to act around 1.2949, I will postpone selling until the next resistance at 1.2984. I will sell only after a false breakout at this level. If there is no downward reaction, I will consider short positions on a rebound from 1.3028, targeting a 30-35 point downward correction.
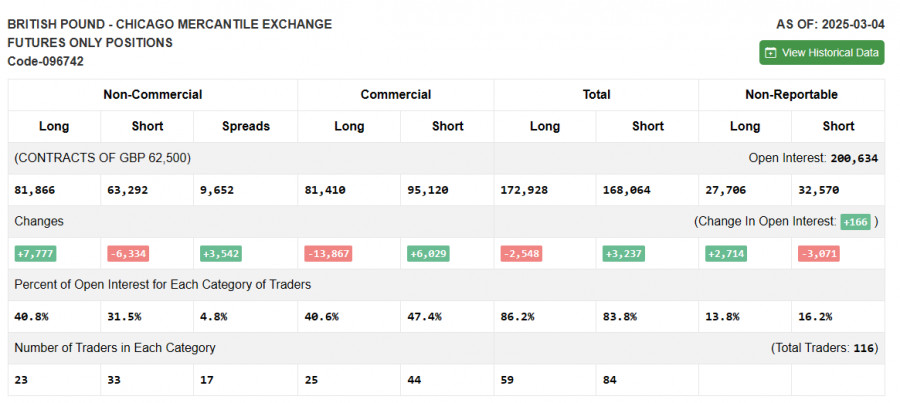
The COT report for March 4 showed a minimal increase in long positions and a reduction in short positions. The growing dominance of buyers suggests that GBP/USD may continue its upward movement.
Considering positive trends in the UK economy and the Bank of England's gradual approach to rate cuts, the pound may continue to strengthen. However, traders should remain cautious about potential corrections, which could occur before new local highs are reached.
The latest COT report indicated that long non-commercial positions increased by 7,777 to 81,866, while short non-commercial positions declined by 6,334 to 63,292. As a result, the gap between long and short positions widened by 3,542.
Trading is taking place around the 30-day and 50-day moving averages, indicating a sideways market trend.
Note: The periods and prices of moving averages analyzed by the author are based on the H1 chart and differ from the standard daily moving averages on the D1 chart.
If GBP/USD declines, the lower boundary of the indicator around 1.2914 will act as support.
You have already liked this post today
*The market analysis posted here is meant to increase your awareness, but not to give instructions to make a trade.
On Wednesday, the GBP/USD currency pair continued a sluggish downward movement, which this time lacked any fundamental support. As a reminder, on Monday, the dollar might see increased demand
On Wednesday, the EUR/USD currency pair continued a mild downward movement, which still falls within the framework of the prevailing uptrend. In other words, we are still observing a correction
Analysis of Tuesday's Trades 1H Chart of GBP/USD On Tuesday, the GBP/USD pair also traded lower for the same reasons as the EUR/USD pair. First, after a conversation with Ursula
Analysis of Tuesday's Trades 1H Chart of EUR/USD On Tuesday, the EUR/USD currency pair continued its downward movement, which had begun on Monday. The dollar continued to strengthen the night
On Tuesday, the GBP/USD currency pair also traded lower for the same reasons as the EUR/USD pair. However, it cannot be said that the British currency depreciated significantly—an upward movement
The EUR/USD currency pair showed a somewhat significant downward movement on Tuesday. However, this move did not impact the overall trend, market sentiment, or the broader context. The strengthening
In my morning forecast, I highlighted the 1.1374 level and planned to make trading decisions based on it. Let's look at the 5-minute chart to analyze what happened. A decline
Forex Chart
Web-version

Your IP address shows that you are currently located in the USA. If you are a resident of the United States, you are prohibited from using the services of InstaFintech Group including online trading, online transfers, deposit/withdrawal of funds, etc.
If you think you are seeing this message by mistake and your location is not the US, kindly proceed to the website. Otherwise, you must leave the website in order to comply with government restrictions.
Why does your IP address show your location as the USA?
Please confirm whether you are a US resident or not by clicking the relevant button below. If you choose the wrong option, being a US resident, you will not be able to open an account with InstaTrade anyway.
We are sorry for any inconvenience caused by this message.


