See also


 21.12.2023 10:11 AM
Technical analysis:
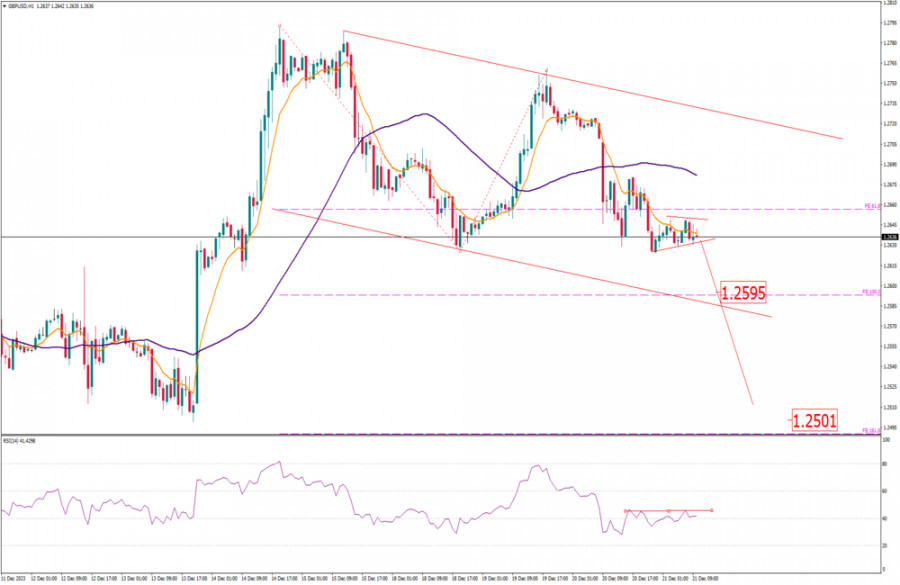
GBP/USD has been trading sideways today at the price of 1.2637 and I see potetnial for the downside breakout and downside continuation.
Due to the downside momentum in the background and RSI reading below 50 mark, I see potential for the further drop in case of the downside breakout of the tight triangle pattern.
Downside objectives are set at the price of 1.2595 and 1.2500
RSI oscillator is showing negative reversals and reading below 50 level, which is good sign for the potential downside continuation.
Key resistance is set at the price of 1.2677
You have already liked this post today
*The market analysis posted here is meant to increase your awareness, but not to give instructions to make a trade.
Useful links: My other articles are available in this section InstaForex course for beginners Popular Analytics Open trading account Important: The begginers in forex trading need to be very careful
Early in the American session, gold is trading around 3,314 with a strong technical rebound originating after reaching the 50% Fibonacci retracement. Gold rose sharply after testing
Early in the American session, the euro is trading around 1.1331 and is experiencing a strong technical rebound after reaching the 4/8 Murray level at 1.1230. The euro could rise
Your IP address shows that you are currently located in the USA. If you are a resident of the United States, you are prohibited from using the services of InstaFintech Group including online trading, online transfers, deposit/withdrawal of funds, etc.
If you think you are seeing this message by mistake and your location is not the US, kindly proceed to the website. Otherwise, you must leave the website in order to comply with government restrictions.
Why does your IP address show your location as the USA?
Please confirm whether you are a US resident or not by clicking the relevant button below. If you choose the wrong option, being a US resident, you will not be able to open an account with InstaTrade anyway.
We are sorry for any inconvenience caused by this message.

